Editor's Note: This post was originally published on February 5, 2015 and has been updated for freshness, accuracy, and comprehensiveness. Any opinions or forecasts in this post reflect the subjective judgments and assumptions of the author as of February 2015.
Crude oil spot prices have dropped in a straight line to around $50 per barrel with no semblance of consolidation since the second half of 2014. In the near-term, weak supply/demand balance, high inventory, poor demand and a risk-averse investor could mean that oil prices will remain depressed, in my opinion.
I expect the Brent benchmark to average around $60 - $65 in 2015 and $70 - $80 in 2016, with risks significantly skewed to the downside in the near term as we may run out of storage capacity globally over the coming quarters.
In my December post, I was closely watching several dynamics that could swing oil prices by more than $10 in each direction. Since then, some clarity has emerged around these issues.
Several bullish factors have strengthened:
- How sustainable is Libya’s production? The period of stability has been extremely fleeting; Libyan production has fallen to 450,000 barrels per day from over 800,000 barrels per day in the fourth quarter of 2014.
- What is the potential long-term impact of sanctions on Iran and Russia? We’ve been looking at CDS contracts and foreign exchange forwards of oil producing countries; the Russian ruble has lost 80% of its value against the US dollar since summer 2014 and Venezuela is trading at default value.
- US shale producers are addressing their capital expenditure – in some scenarios, spending is down 40%.[i]
This suggests to us that current prices may be too low for the longer term. If spot prices continue to trade at these levels for an extended period of time, it could result in an important geopolitical event like political instability in an oil producing country coping with a curtailed budget.
Several bearish factors continue to be at play:
- Unperturbed about the poorer OPEC member countries, Saudi Arabia seems intent on going head-to-head with the US for market share. There is no longer a free OPEC put, which I believe could render the cartel irrelevant going forward.
- Inventories have continued to build at a rapid pace on the product as well as the crude side. Supply continued to outpace demand in the fourth quarter and we are approaching extremely high inventory levels.[i] Seasonally, heating oil demand in the US has been lackluster due to warmer than normal weather in November and December.
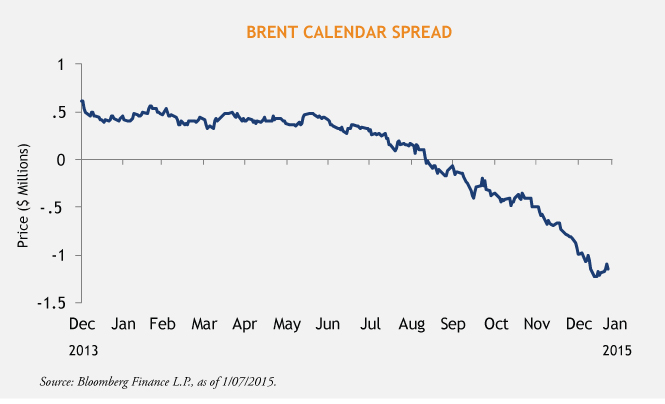
- Despite low prices, demand outside the US has moved sideways. As you can see on the chart below, crude oil calendar spreads are deep in contango.
What does this all mean for oil prices?
 Predicting oil pricing is a three dimensional problem: supply-side economics, demand growth and inventory.
When inventories are low and supply-demand balance is tight, commodities tend to trade at a premium to marginal cost. However, the reverse occurs when commodity balances are loose – commodities tend to trade closer to marginal cost.
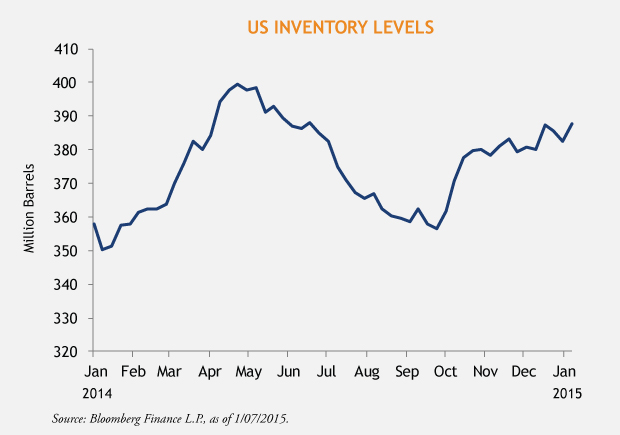
As the chart below shows, we have commenced 2015 with extremely high inventories and commodity calendar spreads in steep contango. This suggests that it is likely we will continue to build inventory well into 2015.
The elastic nature of supply and less elastic nature of demand suggests that the price upside is capped at some point. If crude oil were to rise to $100, supply would increase and we would have to revisit this situation a few months down the road. We believe that medium term upside is capped somewhere below the $100 price that we have been used to over the past few years.

[i] EOG Resources, “Investor Presentation: What’s new in 2015?”, May 2015
[i] US Energy Administration, Analysis and Projections, 2015
MALR013757
This was originally published on February 5, 2015. We have updated the content as necessary and otherwise believe the information is current and relevant.
Past results are not necessarily indicative of future results.
This is not an offer of, or a solicitation of an offer for, any investment strategy or product. Any investment that has the possibility for profits also has the possibility of losses. Views and opinions are based on current market conditions which will change.


 Predicting oil pricing is a three dimensional problem: supply-side economics, demand growth and inventory.
