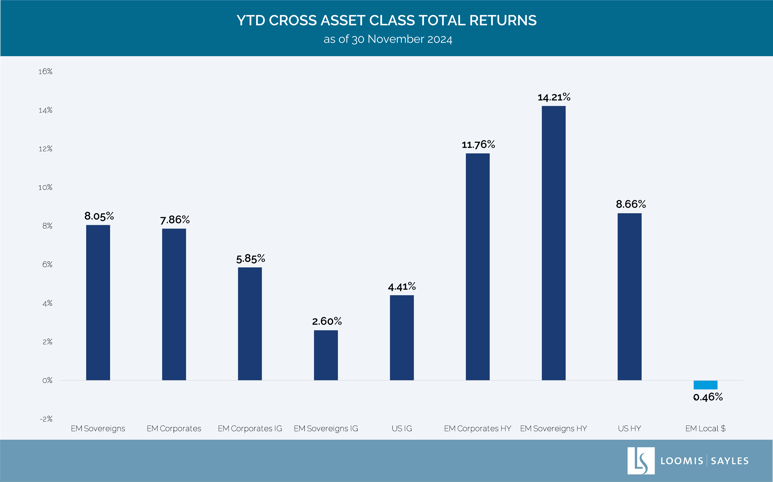
Given how much the emerging market (EM) debt universe has evolved, we believe blanket statements about the sector should be a thing of the past. However, even now, headlines often do not distinguish between the characteristics of EM local-currency bonds versus those of EM corporate and sovereign bonds issued in US dollars. The following chart shows one reason why we believe EM fixed income shouldn’t be painted with a broad brush.
From January through November 2024, US-dollar-denominated EM sovereign bonds and corporate bonds have provided positive returns while EM local-currency government bonds have struggled against a strong US dollar. Notably, US-dollar-denominated EM corporate bonds have outperformed their US investment grade and US high yield counterparts. Currency volatility often makes the news, but the challenges affecting the local-currency index have had little to no impact on the EM hard-currency asset class performance, which has continued to benefit from countries experiencing economic growth, strong company fundamentals and global interest rate easing.
The lack of uniformity among the asset classes under the EM debt umbrella point to the myriad of drivers that can influence performance. We believe the multifaceted offerings found in the sector varying across country, credit quality and currencies can mean more choices for investors—offerings best examined with a fine-tooth comb.

Source: JP Morgan, Bloomberg as of 30 November 2024. Returns calculated from 31 December 2030 November 2024. EM Corporate IG= JP Morgan CEMBI Broad Diversified IG Index, EM Sovereign IG= JP Morgan EMBI Global Diversified IG Index, EM Corporate HY= JP Morgan CEMBI Broad Diversified HY Index, EM Sovereign HY =JP Morgan EMBI Global Diversified HY Index, US IG = Bloomberg US IG Corporate Index, US HY = Bloomberg US High Yield Index, EM Corporates = JP Morgan CEMBI Broad Diversified Index, EM Sovereigns= JP Morgan EMBI Global Diversified Index.
Used with permission from Bloomberg.
The chart presented above is shown for illustrative purposes only. Some or all of the information on this chart may be dated, and, therefore, should not be the basis to purchase or sell any securities. Information obtained from outside sources is believed to be correct, but Loomis Sayles cannot guarantee its accuracy. This material cannot be copied, reproduced or redistributed without authorization.
Indices are unmanaged and do not incur fees. It is not possible to invest directly in an index.
Past market experience is no guarantee of future results.

SAIFkcbhygji


