November 2015 ranked as the 25th warmest November in the last 121 years. The weather was exceptionally mild in regions most often affected by cold (New England, the mid-Atlantic states and the Midwest).
October was also warmer than typical – but not as warm as November. These weather developments may very well be related to the “El Niño” phenomenon in the Pacific Ocean.
A warm spell like this can wreak havoc with economic data:
Housing permits and starts
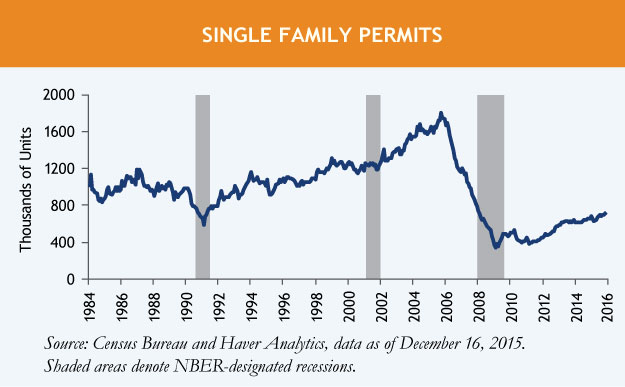
 Permits for single-family houses rose 1.1% in November, continuing their steady yet moderate recovery. Meanwhile, single-family housing starts advanced a hefty 7.6% because warm weather allowed developers to move rapidly to begin projects which already had their permits.
Permits have historically been much less affected by weather; while starts are dependent on weather. So permits can be a better gauge of the vitality in the housing sector. November’s permits were the highest in eight years, indicating ongoing recovery, but they still remain well below normal levels.

The consumer sector
 Most categories of retail sales spending rose firmly in November, and spending on restaurants and bars rose a robust 0.8%. Light vehicle sales in November surprised the market by staying over an 18 million unit annualized rate. Consumer spending is being supported by rising employment and low inflation, but I venture a guess that the mild weather of November gave consumer spending an extra boost. People are more willing to go out and spend when the weather is pleasant.
The first half of December was also warmer than typical nationwide, particularly in the Northeast and Midwest. This should give December holiday spending a bit of a boost.
Industrial production
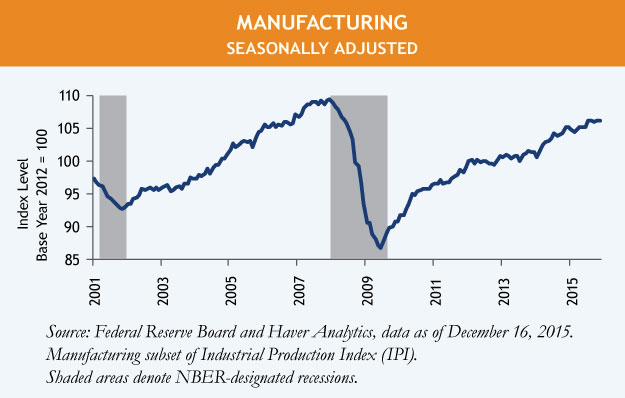
 Industrial production surprised the market by falling 0.4% in October and 0.6% in November. This surprise might suggest that manufacturing is in trouble, but we’re not jumping to that conclusion. Manufacturing production (which is 78% of total industrial production) rose 0.3% in October and was basically unchanged in November. Despite all the bad news about slumping exports and excessive inventories, manufacturing production is still on an upswing, albeit a weak one.
Utility output (which is 10% of industrial production) was down a sharp 4.3% plunge (one of the largest drops in two decades) and 2.8% in October. Warmer-than-usual weather reduced demand for heating, thereby cutting electrical power production and natural gas distribution. It was the atypical warm weather in October and November that caused the declines in industrial production, not a slump in manufacturing.


MALR014406
Sources: Census Bureau, Federal Reserve Board and Haver Analytics as of Dec 16, 2015.


 Permits for single-family houses rose 1.1% in November, continuing their steady yet moderate recovery. Meanwhile, single-family housing starts advanced a hefty 7.6% because warm weather allowed developers to move rapidly to begin projects which already had their permits.
 Most categories of retail sales spending rose firmly in November, and spending on restaurants and bars rose a robust 0.8%. Light vehicle sales in November surprised the market by staying over an 18 million unit annualized rate. Consumer spending is being supported by rising employment and low inflation, but I venture a guess that the mild weather of November gave consumer spending an extra boost. People are more willing to go out and spend when the weather is pleasant.
 Industrial production surprised the market by falling 0.4% in October and 0.6% in November. This surprise might suggest that manufacturing is in trouble, but we’re not jumping to that conclusion. Manufacturing production (which is 78% of total industrial production) rose 0.3% in October and was basically unchanged in November. Despite all the bad news about slumping exports and excessive inventories, manufacturing production is still on an upswing, albeit a weak one.

