
 By
By 
The US government has been negotiating and implementing tariff policies with the goal of balancing trade between the US and its trading partners. China has stood out as a primary target for tariffs due to its gigantic trade surplus with the US.
At the heart of this imbalance is the US’s ranking as the world’s largest consumer and China’s status as the world’s largest producer. Is it realistic to expect China to produce less and consume more? Our short answer—no.
 Source: World Bank. US and European Union data as of 30 June 2024, China data as of as of 30 June 2023.
Chronic overproduction
China has an overcapacity problem, meaning it produces more than it can sell, and it’s getting worse. The share of loss-making by industrial firms with annual revenues of more than 20 million renminbi increased to 30% by June 2025, up from 15% in 2012.[1] Industrial capacity utilization stood at 74.6% on 30 September 2025, matching 2015 trough levels.[2] Compared to the 2015 to 2016 deflation experience, when excess capacity was concentrated in state-owned enterprises, shutting down production this time around is not likely to be as easy. Current overcapacity primarily exists in sectors dominated by private firms. Additionally, we believe cutting output would cost jobs and choke China’s export engine at a time when growth is already slowing rapidly.
Roadblocks to increasing consumption
Overall consumption in the US is 46% of GDP, which is in stark contrast to China’s consumption at 18% of GDP.[3] Delving into the data reveals more about the disparity. Goods consumption in China and the US has been roughly similar as a percentage of their respective GDPs. It is China’s underconsumption of services that almost completely explains the difference in the overall consumption rates between the two nations. Unfortunately, this also means China has little room to raise spending on goods, which already matches the US level as a share of GDP.
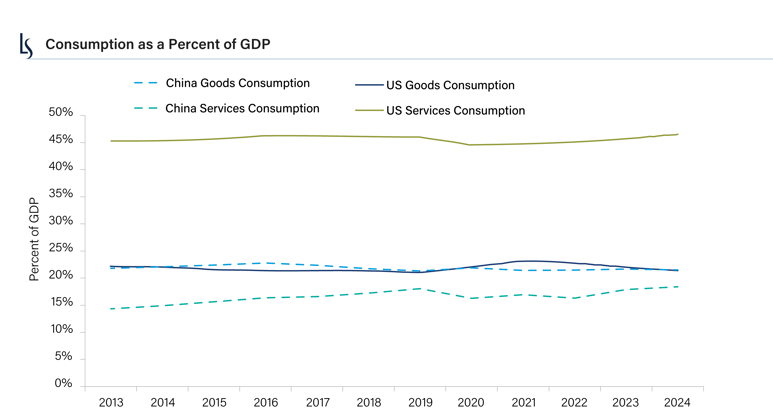
Source: CEIC, Loomis Sayles calculations. Data as of 31 December 2024.
Structural hindrances
The Chinese consumer is weighed down by structural factors that are difficult to change, in our view.
- Negative wealth effect: Declining housing prices have eroded household net worth and have prompted families to cut back on discretionary spending.
- Lack of financial incomes: China's household balance sheets are dominated by home values. Financial assets are skewed toward low-yielding products, and dividend income from Chinese stocks has historically been ultra-low.
- Deficient wage growth: Urban wage growth has declined to a record low, adding downward pressure on consumer spending. In addition, long working hours in China depress leisure time and services consumption.
- Aging population and inadequate social safety net: There have been sharp declines in China’s birth rate and the number of marriages. Both trends are shrinking markets related to new household formation. The lack of adequate retirement support amplifies precautionary savings motives and weighs on spending.
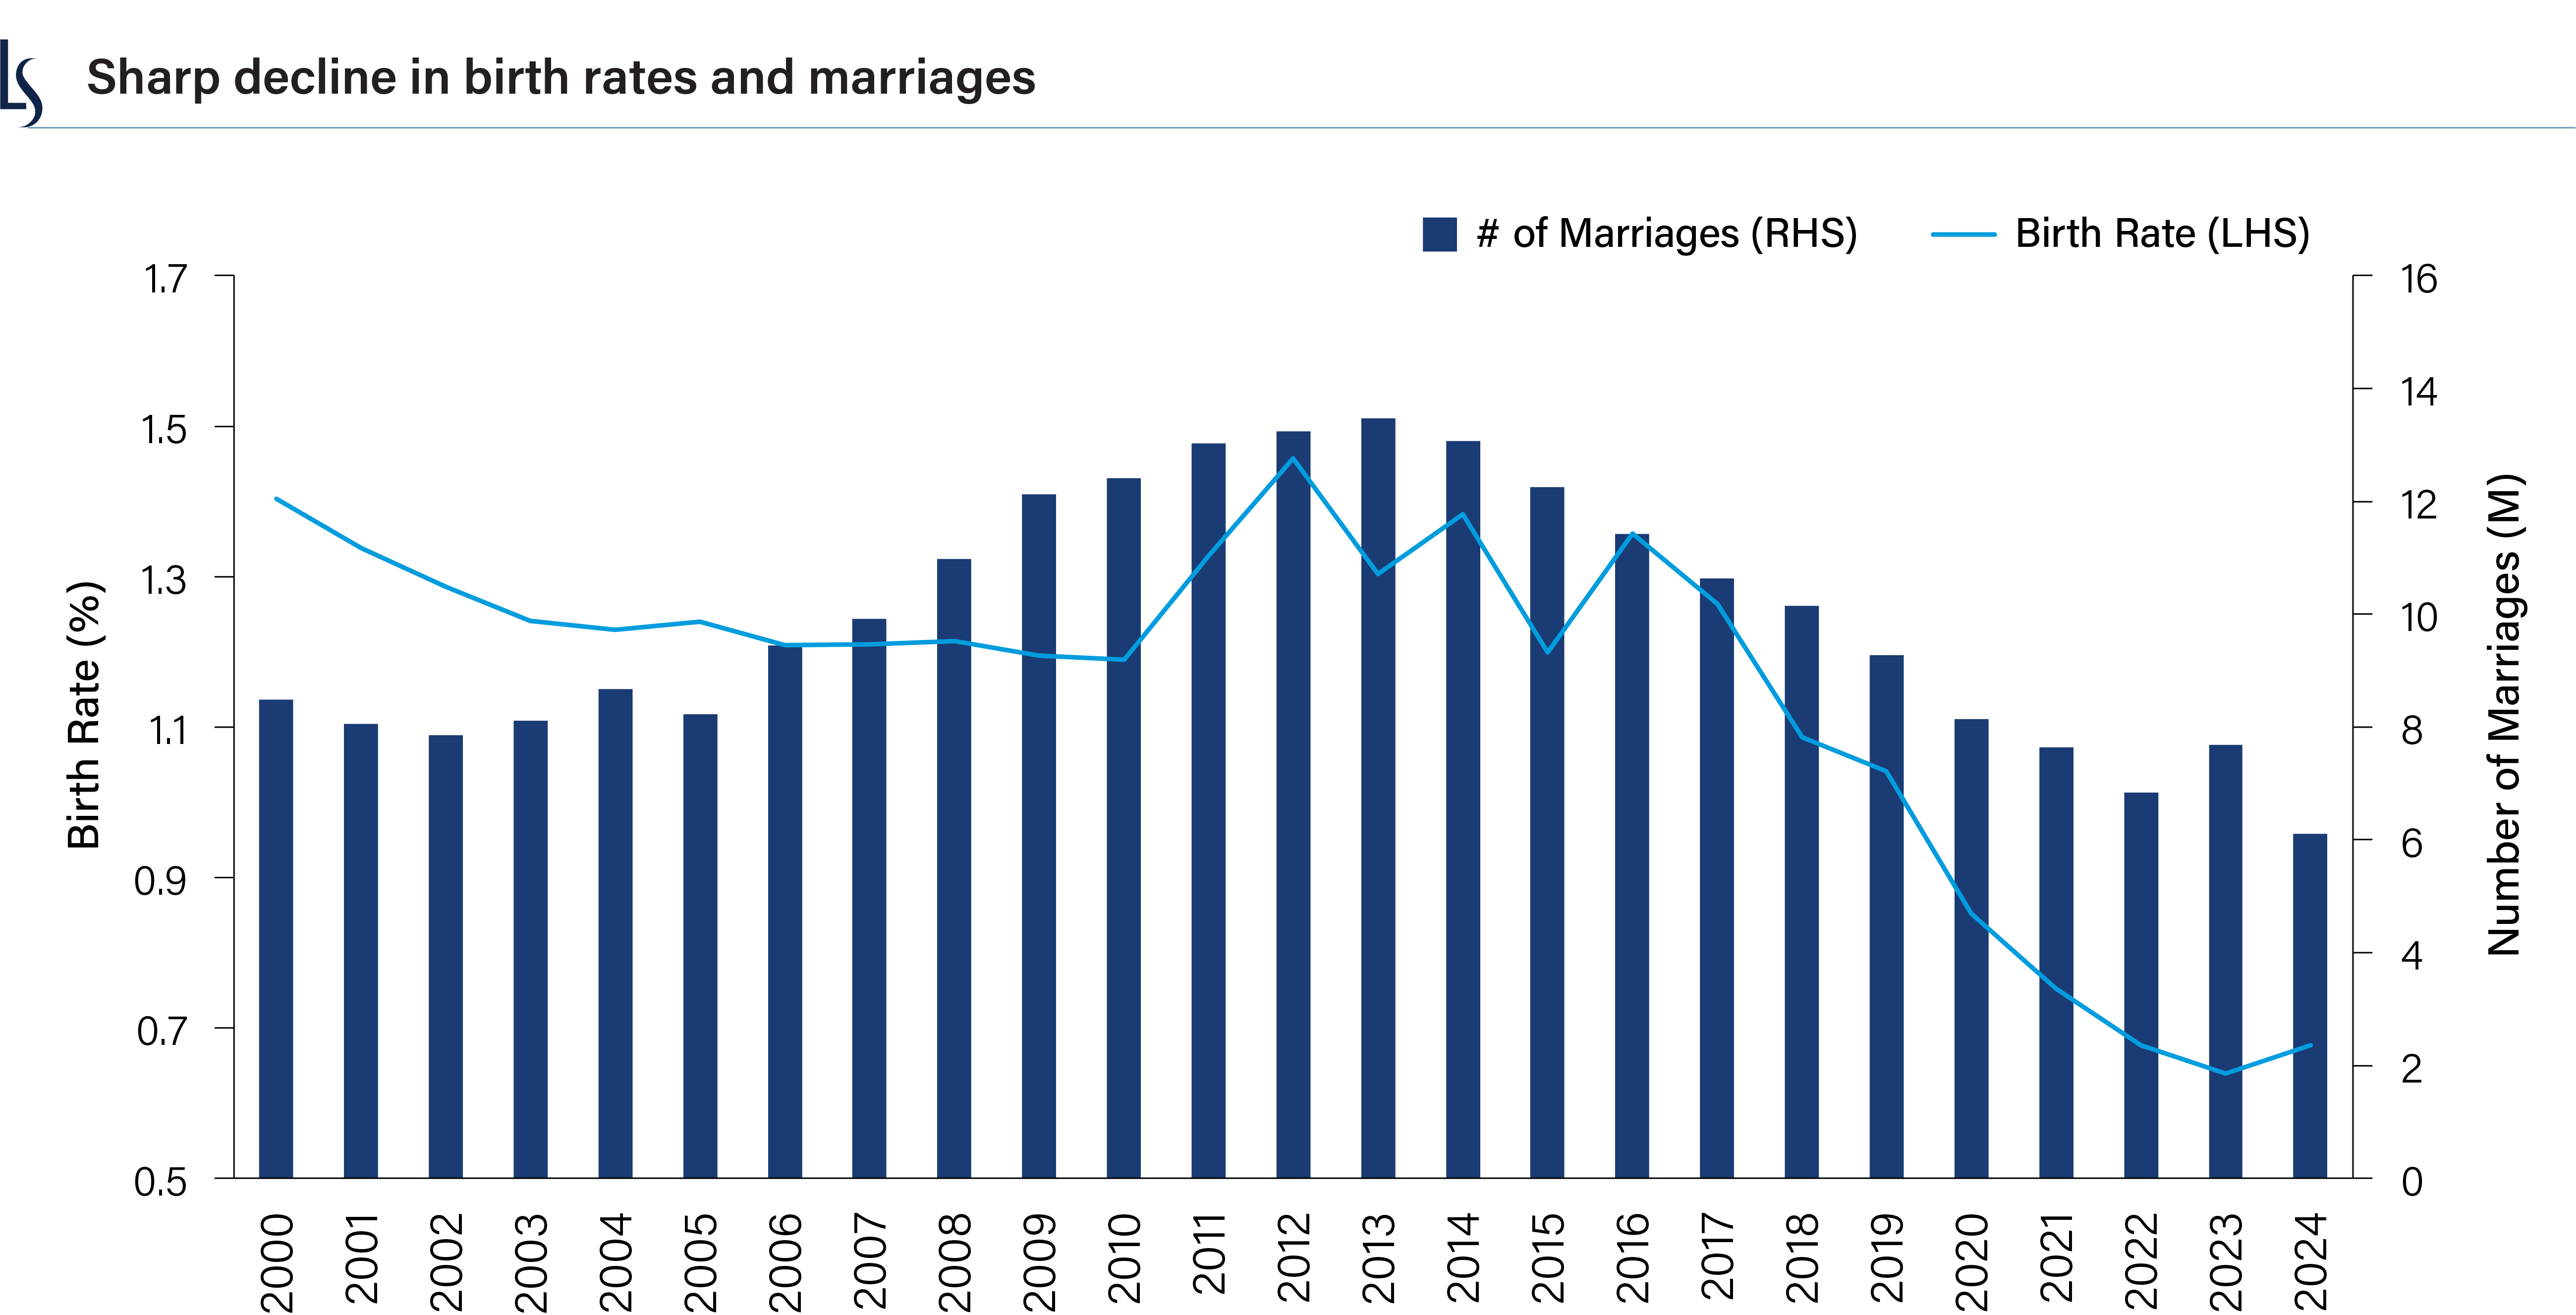
Source: Standard Chartered, 1 December 2024.
Conclusion
Tariffs may change trade flows at the margin, but they are a surface-level fix for a deeper problem. In our view, the real source of imbalance lies within China’s own domestic economy—its weak consumption and chronic overproduction. Until those structural issues are addressed, we believe trade between the US and China will remain lopsided.
WRITTEN BY:
Bo Zhuang, Global Macro Strategist, Asia
Kaimin Khaw, Global Macro Strategist, Asia

8599573.1.1
[1] National Bureau of Statistics.
[2] National Bureau of Statistics.
[3] World Bank, US data as of 2024, China data as of 2023.
Market conditions are extremely fluid and change frequently.
This blog post is provided for informational purposes only and should not be construed as investment advice. Any opinions or forecasts contained herein reflect the
subjective judgments and assumptions of the authors only and do not necessarily reflect the views of Loomis, Sayles & Company, L.P. Information, including
that obtained from outside sources, is believed to be correct, but Loomis Sayles cannot guarantee its accuracy. This material cannot be copied, reproduced or
redistributed without authorization. This information is subject to change at any time without notice.

