
 By
By 
French and Italian 10-year yields have converged over the past several months. Both are currently just under 3.5% against the backdrop of a 2.0% European Central Bank (ECB) policy rate. There is one narrative that focuses on French political instability and the risk it poses to fiscal consolidation as the reason for the recent convergence. I find it interesting to entertain an alternate interpretation: instead of a reaction to rising risks, what if the French yield curve reflects a return to “normal”?
What does a “normal” European cycle look like?
To give this theory context, we have to revisit the early aughts. From June 2003 until December 2005, the ECB kept the policy rate at 2.0% (again, where it is now). In our view, this period was arguably the most “normal” cycle in the euro area since it was established in 1999: it was after the initial period of convergence, but before the sovereign/banks crisis and negative rates/quantitative easing, and the post-COVID-19 inflation shock and rate ratchet. During that 2003 to 2005 stretch, 10-year German Bund yields averaged 3.8% and traded in a range of 3.0% to 4.5%. We think this range could represent a “normal” relationship between a 10-year European government bond yield and the policy rate.
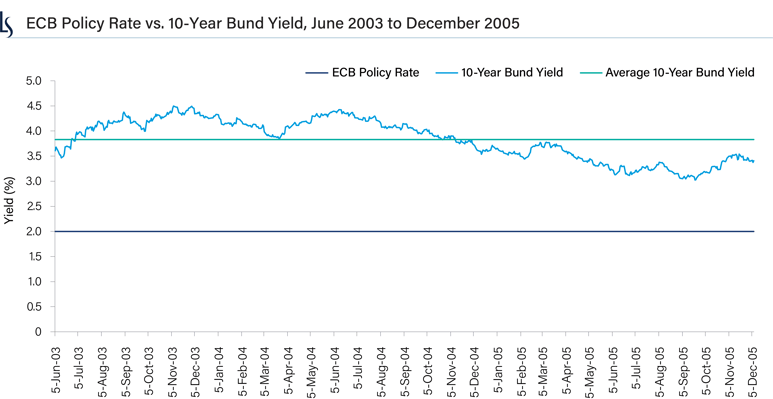
Source: Bloomberg, as of 2 October 2025.
The chart presented above is shown for illustrative purposes only. Some or all of the information shown may be dated, and, therefore, should not be the basis to purchase or sell any securities. The information is not intended to represent any actual portfolio managed by Loomis Sayles.
Is the Bund the outlier?
Fast forward to today. If you step back and think purely in terms of the relationship between policy and the long end, the 2003-2005 cycle suggests that the current French and Italian curves look quite normal, and that the Bund—with a 10-year yield around 2.7%—is the outlier.
A key question here is whether the policy and asset allocation evolutions of the past few years will continue to keep 10-year Bund yields tighter to the policy rate than in past environments. Or, if the Bund may be experiencing its own temporary factors and ultimately drift higher, particularly if the ECB remains on hold at 2% for some time. There is a scenario in which, over time, Bund yields drift higher, yet France and Italy remain more firmly anchored by the policy rate and a more persistent curve shape emerges. French politics may have simply brought French yields to a very normal place.
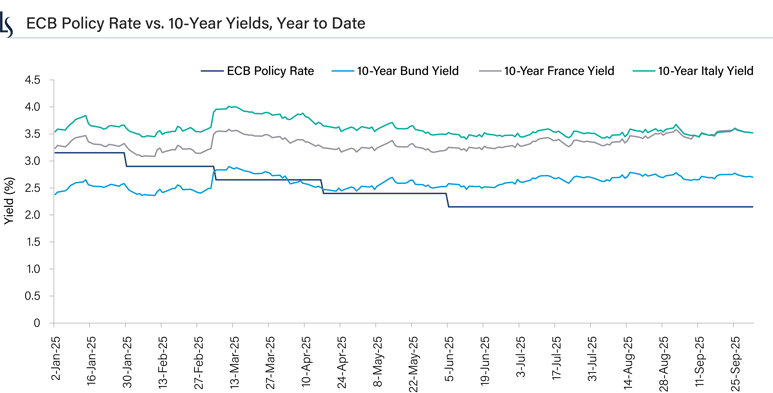
Source: Bloomberg, as of 2 October 2025.
The chart presented above is shown for illustrative purposes only. Some or all of the information shown may be dated, and, therefore, should not be the basis to purchase or sell any securities. The information is not intended to represent any actual portfolio managed by Loomis Sayles.

8469377.1.1
Market conditions are extremely fluid and change frequently.
This blog post is provided for informational purposes only and should not be construed as investment advice. Any opinions or forecasts contained herein reflect the
subjective judgments and assumptions of the authors only and do not necessarily reflect the views of Loomis, Sayles & Company, L.P. Information, including
that obtained from outside sources, is believed to be correct, but Loomis Sayles cannot guarantee its accuracy. This material cannot be copied, reproduced or
redistributed without authorization. This information is subject to change at any time without notice.

