
 By
By 
The Federal Reserve’s third-quarter data on household balance sheets showed that household debt (two-thirds of which is mortgage debt) reached a new record high, climbing to $14.8 trillion. Except for home equity loans, every kind of debt rose from a year earlier.
That may sound worrisome, but it’s really not.
Debt by itself is neither too high nor too low; it can only be judged relative to the capacity to service the debt. Income is a gauge of the capacity to service debt. The ratio of household debt to personal disposable income rose a tiny bit from a year ago, from 102% in the third quarter of 2016 to 103% in the third quarter of 2017. This ratio has moved in a narrow channel for the past three years.
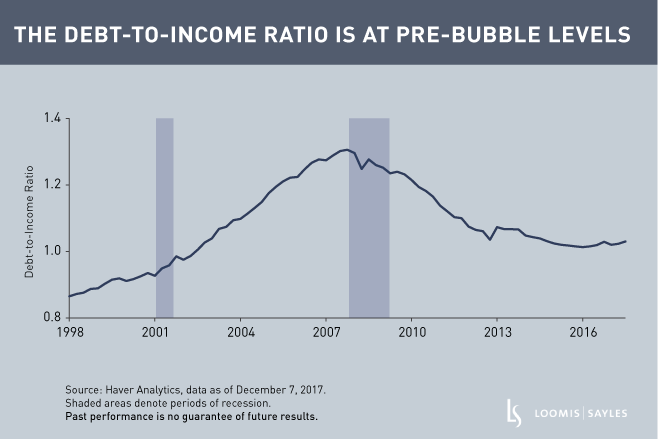
Before and after the bubble
Households built up a lot of leverage through the 1980s and 1990s and especially in the housing bubble years of the 2000s. It was normal for the ratio of debt to income to rise as many households flipped from being renters to homeowners. The problem was that during the bubble years, new buyers were making smaller down payments at the time of purchase while existing homeowners were aggressive in cashing out their capital gains, using second mortgages or home equity loans. In addition, some were making highly-leveraged speculative real estate investments. Homeowners went too far in the end, with the debt-income ratio peaking at a record high of 131% in the fourth quarter of 2007 as the recession was about to begin.
The housing bubble burst. Households spent the next eight years reversing the leverage surge of the bubble years. In the first four years post-bubble, there were absolute reductions in leverage (by paying down debt, but also by foreclosure and bankruptcy). In the next four years, households increased borrowing but the debt-to-income ratio fell because debt grew more slowly than income.
Today, there is no more deleveraging relative to income, but households aren’t building leverage either. The ratio has returned roughly to where it was in 2002. The bubble has been undone; in aggregate, households have displayed admirable thrift.
Alas, the story is different elsewhere. Corporate America, excluding financial companies, has increased its leverage to record highs while the federal government has increased its leverage to the highest since the aftermath of World War II (leverage in these two sectors is measured by the ratio of debt to GDP). Corporations and the government could do worse than imitate households.
MALR021141
Market conditions are extremely fluid and change frequently.
This blog post is provided for informational purposes only and should not be construed as investment advice. Any opinions or forecasts contained herein reflect the
subjective judgments and assumptions of the authors only and do not necessarily reflect the views of Loomis, Sayles & Company, L.P. Information, including
that obtained from outside sources, is believed to be correct, but Loomis Sayles cannot guarantee its accuracy. This material cannot be copied, reproduced or
redistributed without authorization. This information is subject to change at any time without notice.

