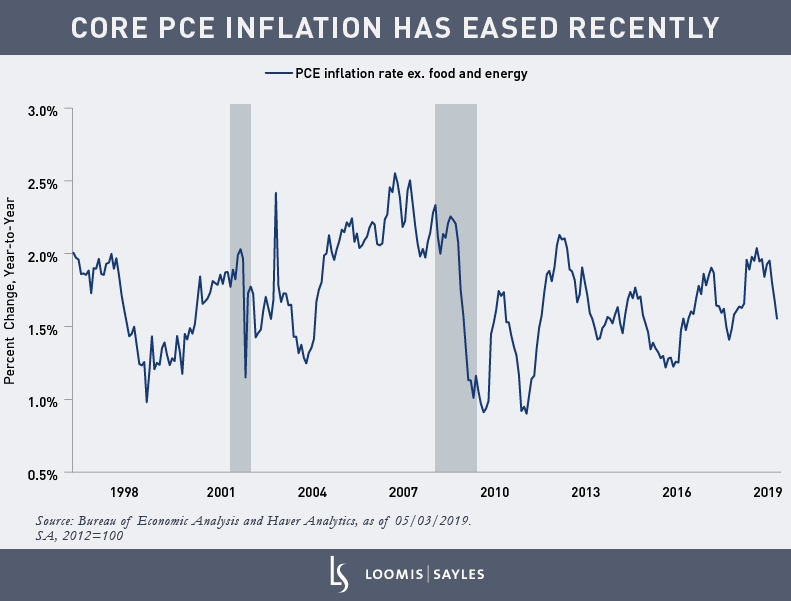
"Core" PCE[1] inflation year over year eased from a recent high of 2.04% last July to 1.55% in March. This easing has made some market participants speculate that the US Federal Reserve will ease up on monetary policy. However, there’s more than one way to measure inflation.

Eliminating the noise
Headline PCE inflation measures price changes in all consumer goods and services. The Fed targets headline PCE inflation over the long term. In the near term, it tends to focus on core inflation, which excludes food and energy prices. Food and energy prices are connected to highly volatile commodity prices, which can cause headline PCE inflation to fluctuate wildly in short periods of time.
The Fed wants to discard the noise and get the true signal of inflation. Core PCE inflation strips away the noise from food and energy. According to this measure, everything else, then, is signal.
The problem is that sometimes food and energy prices behave well. And sometimes, there are flukes and outliers elsewhere in consumer prices. For example, last January, the price index of financial services saw a huge drop, probably related to the stock market slump in autumn 2018. Last March, the Bureau of Labor Statistics introduced new “big data” methods, which contributed to a record drop in apparel prices. Two years ago, Verizon’s aggressive promotional campaign led to a huge drop in cell phone service prices.
A different approach
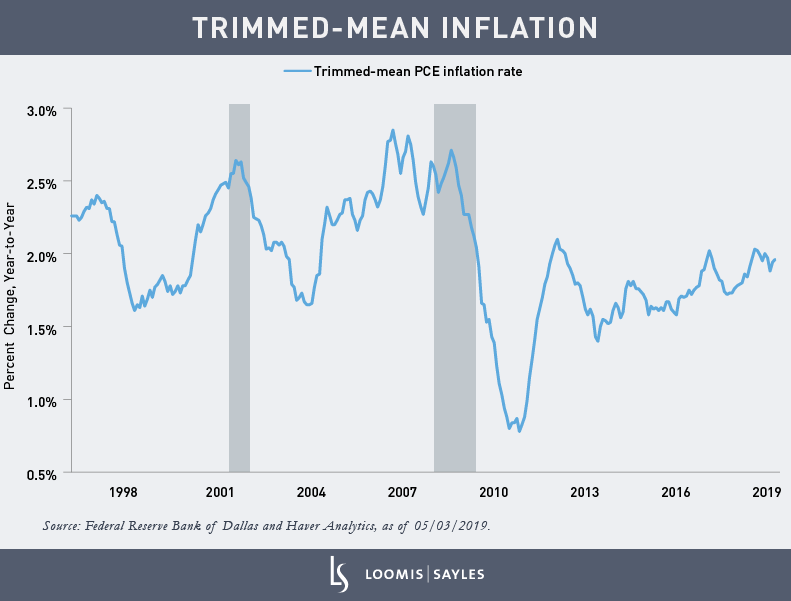
Trimmed-mean inflation is another way to reduce the noise in inflation. The Dallas Fed has advanced this approach, which removes outliers from the inflation rate rather than always removing food and energy. The Dallas Fed staff takes raw PCE price data, computes a distribution of price changes, and removes the very high or very low inflation rates for individual components. The outliers are the noise. In my view, the trimmed-mean inflation rate gives us a true signal on inflation.
The chart below shows the year-over-year inflation rate of the trimmed-mean PCE price index. Last July, this measure was 2.03%. In March, it was 1.96%. So, in contrast to core PCE inflation, trimmed-mean PCE inflation shows no significant decline in the inflation rate from July 2018 to March 2019. In fact, it has been in the 1.9% to 2.0% range in each of the past 11 months.

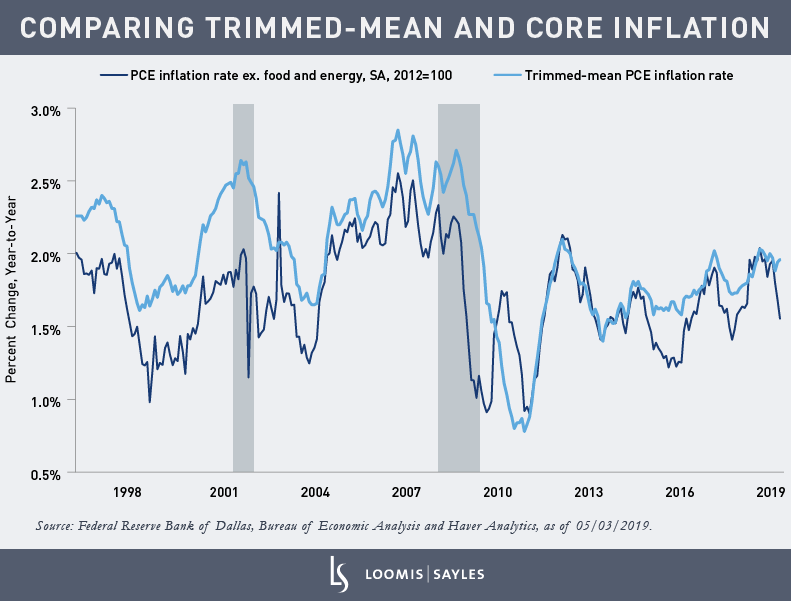
The year-over-year core PCE and trimmed-mean PCE inflation rates show a 71% correlation, which is good, but by no means perfect. When comparing the two, you can see that the core inflation measure can be far more volatile than the trimmed-mean inflation measure.

The Fed is unlikely to panic
Notably, the average (both mean and median) of the trimmed-mean inflation rate over the past 20 years is 2.0%, which is the Fed's target. The Fed is very aware of the trimmed-mean PCE inflation rate. Maybe the Fed has implicitly been targeting the trimmed-mean inflation rate all this time, without saying so. Either way, I do not think the recent noise in core PCE inflation data is going to cause the Fed to panic.

[1] Personal consumption expenditures (PCE), or the PCE Index, measures price changes in consumer goods and services. Expenditures included in the index are actual US household expenditures.
Examples above are provided to illustrate the investment process for the strategy used by Loomis Sayles and should not be considered recommendations for action by investors. They may not be representative of Loomis Sayles current or future investments and they have not been selected based on performance. Loomis Sayles makes no representation that they have had a positive or negative return during the holding period.
Commodity, interest and derivative trading involves substantial risk of loss. This is not an offer of, or a solicitation of an offer for, any investment strategy or product. Any investment that has the possibility for profits also has the possibility of losses.
MALR023582


