
 By
By 
Volatility returned in a big way earlier this week. Over the past few trading sessions, equity market volatility as measured by the VIX[i] more than doubled, and global equities from Europe to the Asia Pacific region suffered steep declines. What happened? Optimism over synchronized global growth and supportive macro conditions led to outsized gains in equity markets to start the year. But more recently, some investors worried the economic momentum was too much of a good thing, and optimism gave way to concerns about the future path of inflation and interest rates.
Volatility has now stabilized somewhat, but clearly the well of optimism that led US equities to new highs has run dry, at least temporarily. But the global economy remains on firm footing, and that has not changed over the past few trading sessions. Here’s a look at what other global markets are signaling to investors and clues about how long the volatility might last.
Flight to quality hasn’t taken off
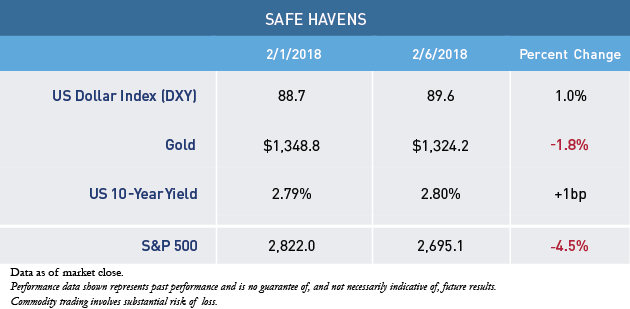
Perceived safe-haven assets that investors tend to favor during episodes of heightened volatility have not been as well bid as one might expect during such a pronounced drawdown in equities. As panic struck the US stock market, there was little evidence of a rush into less risky assets. Mixed and generally muted performance across the US dollar, gold and US Treasurys provides some evidence that systemic risk has not risen materially.
Other risk assets have held up
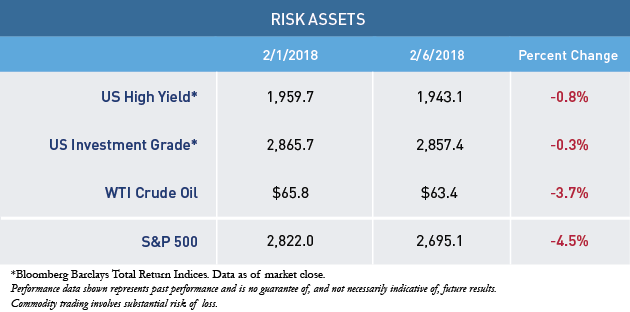
Corporate bond performance has also continued to hold up well despite the equity market correction, which is the largest in over 400 trading days. Fixed income credit indices that track US high yield and investment grade performance are generally down less than 1% over the past few sessions, indicating limited anxiety in those markets. High yield spreads are also holding in fairly tight near five-year lows, reflecting still favorable financial conditions. Certain commodities and crude oil have traded lower most recently, but not to a point that should ring alarm bells from a macro perspective. The selling pressure appears largely isolated to equity markets at the present time.
What’s next?
The shape of the VIX curve suggests that current levels of heightened volatility may not persist for very long. The curve is currently inverted, meaning futures contracts that price near-term volatility are now higher than contracts that price forward volatility in the months of March, April, May and beyond. This signals that market volatility is likely to cool in the months ahead.
Outside of technicals, the fundamental backdrop for corporate earnings and the US economy have remained robust. Globally, solid real GDP growth in 2018 and faster corporate profit growth remain key pillars to the bull market. The correction, while broadly isolated to equities, is certainly a bump in the road; however, long-term fundamentals have remained positive. As equities find a level from which to rally, we will be watching other asset classes for signs of stress that could potentially impede our favorable outlook.
[i] The Cboe Volatility Index® (VIX® Index) is a measure of market expectations of near-term volatility conveyed by S&P 500® Index stock index option prices.
MALR021359
Performance data shown represents past performance and is no guarantee of, and not necessarily indicative of, future results.Commodity trading involves substantial risk of loss. Indices are unmanaged and do not incur fees. It is not possible to invest directly in an index. This is not an offer of, or a solicitation of an offer for, any investment strategy or product. Any investment that has the possibility for profits also has the possibility of losses.
Investment recommendations may be inconsistent with these opinions. There is no assurance that developments will transpire as forecasted and actual results will be different.
Market conditions are extremely fluid and change frequently.
This blog post is provided for informational purposes only and should not be construed as investment advice. Any opinions or forecasts contained herein reflect the
subjective judgments and assumptions of the authors only and do not necessarily reflect the views of Loomis, Sayles & Company, L.P. Information, including
that obtained from outside sources, is believed to be correct, but Loomis Sayles cannot guarantee its accuracy. This material cannot be copied, reproduced or
redistributed without authorization. This information is subject to change at any time without notice.

