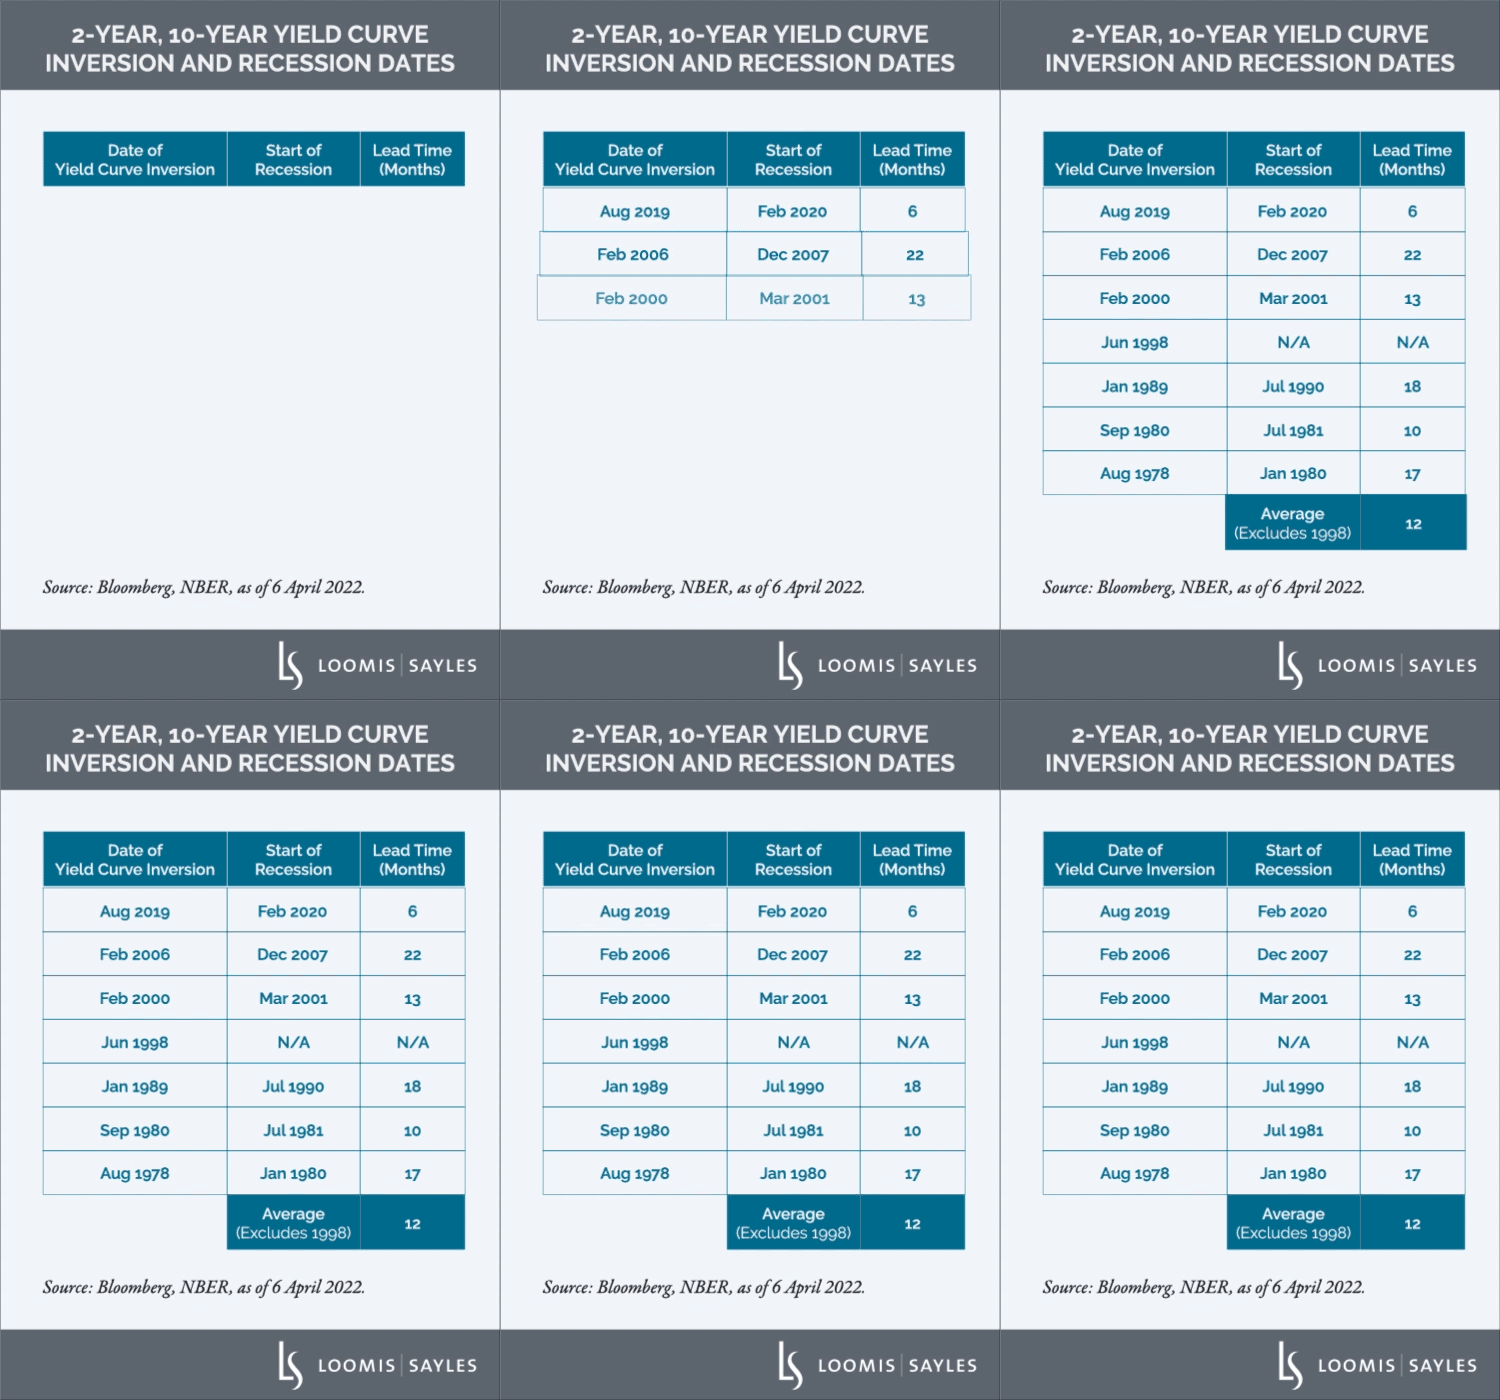
The sudden inversion of the 2-year, 10-year (2s10s) US Treasury yield curve has investors wondering if a recession is imminent. Inversion of the bellwether 2s10s curve preceded all six recessions since 1978. There has been only one instance in that period where a recession failed to follow a sustained inversion of the curve within two years. In our view, the yield curve's reputation as a recession signal is well earned. That said, it’s not infallible. Though we are wary of suggesting that “it’s different this time,” we see reasons to believe the onset of recession will take longer than usual.
An economy on solid footing

First, consider that the economy remains on solid footing. Consumer balance sheets are still strong, nominal incomes are robust and the corporate sector is very healthy in our view. To be sure, there are significant risks to the expansion. Global central banks are on course to tighten monetary policy amid excessive inflationary pressures. The ongoing war between Russia and Ukraine has added further hardship, supply-side disruptions and geopolitical uncertainty. Still, in the absence of a significant escalation in the Russia-Ukraine conflict, we believe the underlying strength and resiliency of the US and global economies can fuel a sustained expansion. As a result, we believe the probability of recession in the next 12 to 24 months remains relatively low, only modestly above our long-term average probability of 10%-20%.
The yield curve is front-running policy actions
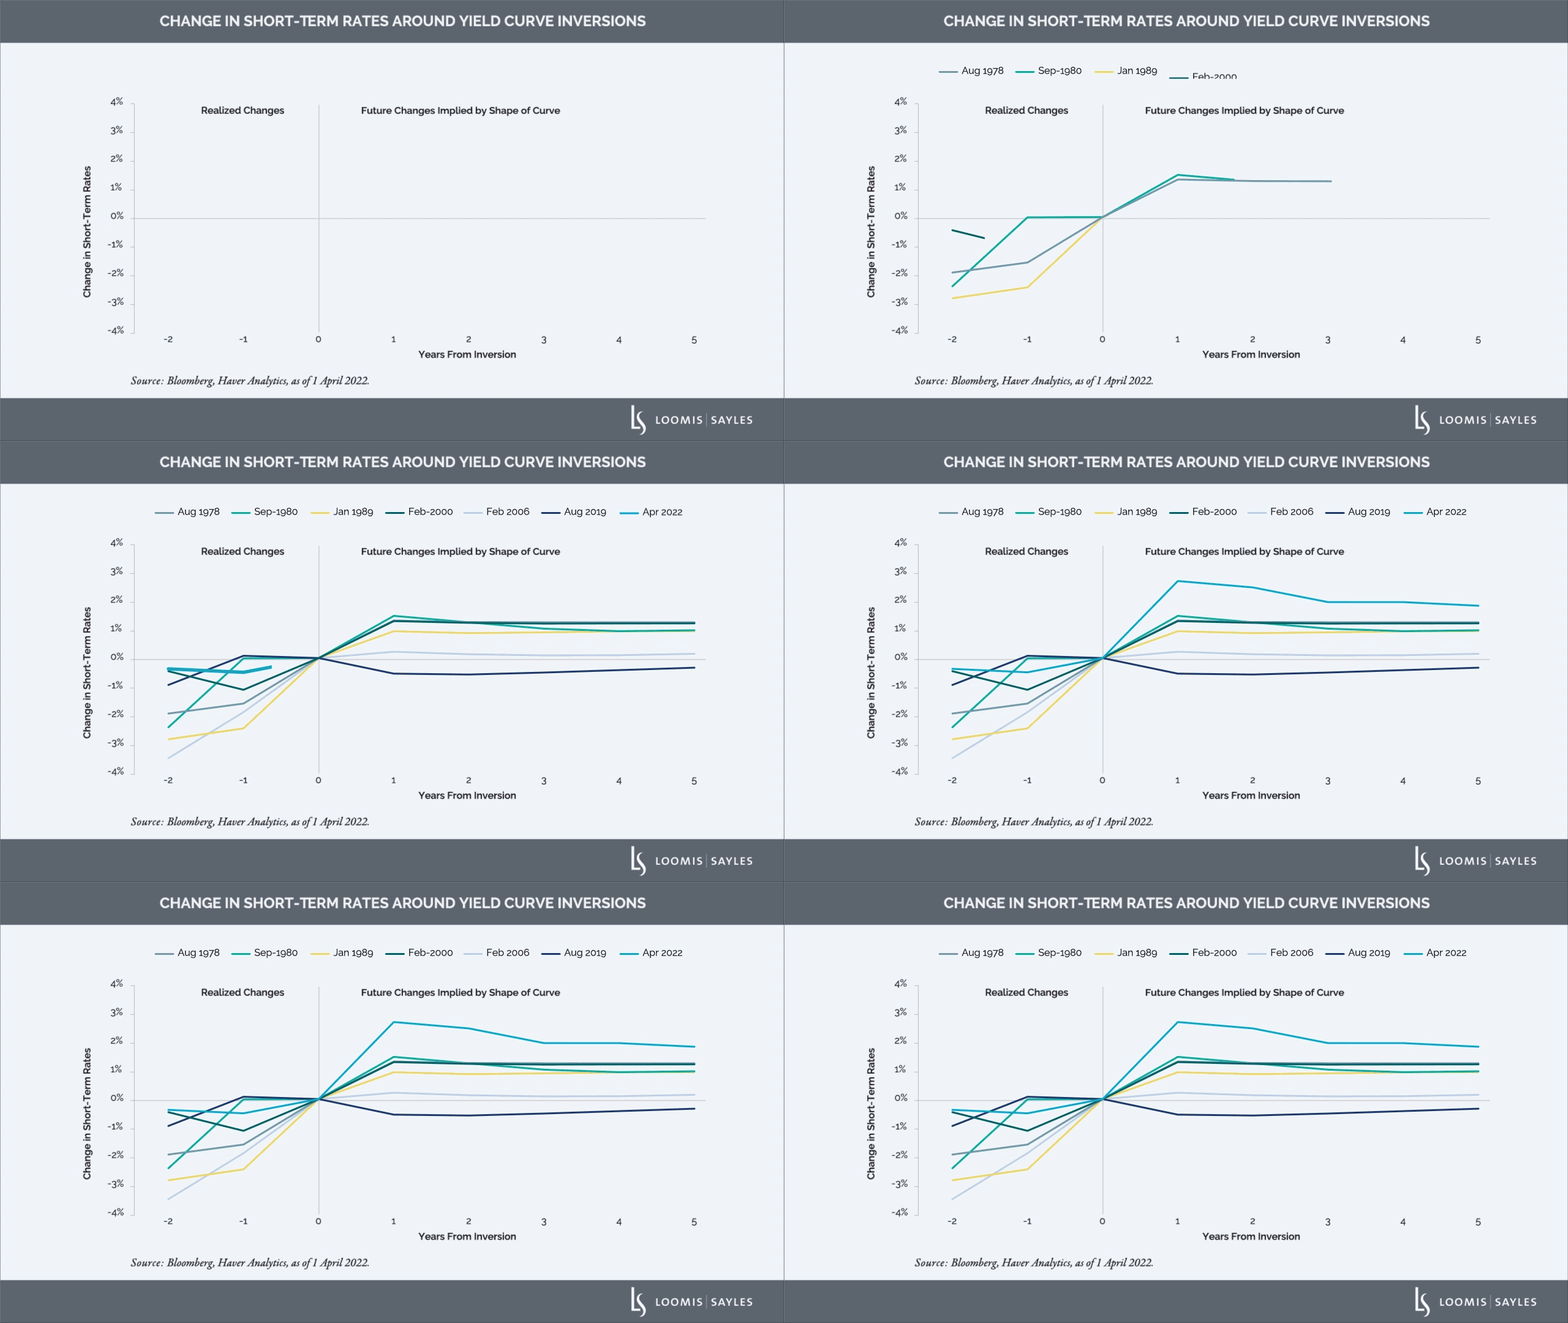
Second, the recent yield curve inversion has been driven almost entirely by increased expectations for future interest rate hikes. To date, the Federal Reserve has implemented only a single 25-basis-point hike, while the shape of the yield curve implies expectations for 275 basis points (bps) of tightening in the next year. Typically, the yield curve inverts after a significant amount of policy tightening has already been put in place. In previous instances of 2s10s inversion, the Fed had hiked an average of about 200 bps prior to inversion, and the shape of the curve implied expectations for less than 100 bps of further tightening (see chart).

So, why does this matter? It’s well understood that monetary policy actions impact the economy with a lag. The yield curve has historically inverted at a time when the market expects previously implemented rate hikes to start impacting economic activity. With today’s inversion based almost solely on expectations for future hikes—and those expectations only recently taking shape—we think it’s plausible to expect a relatively longer lead time from curve inversion to the onset of a potential recession.
A benign outlook
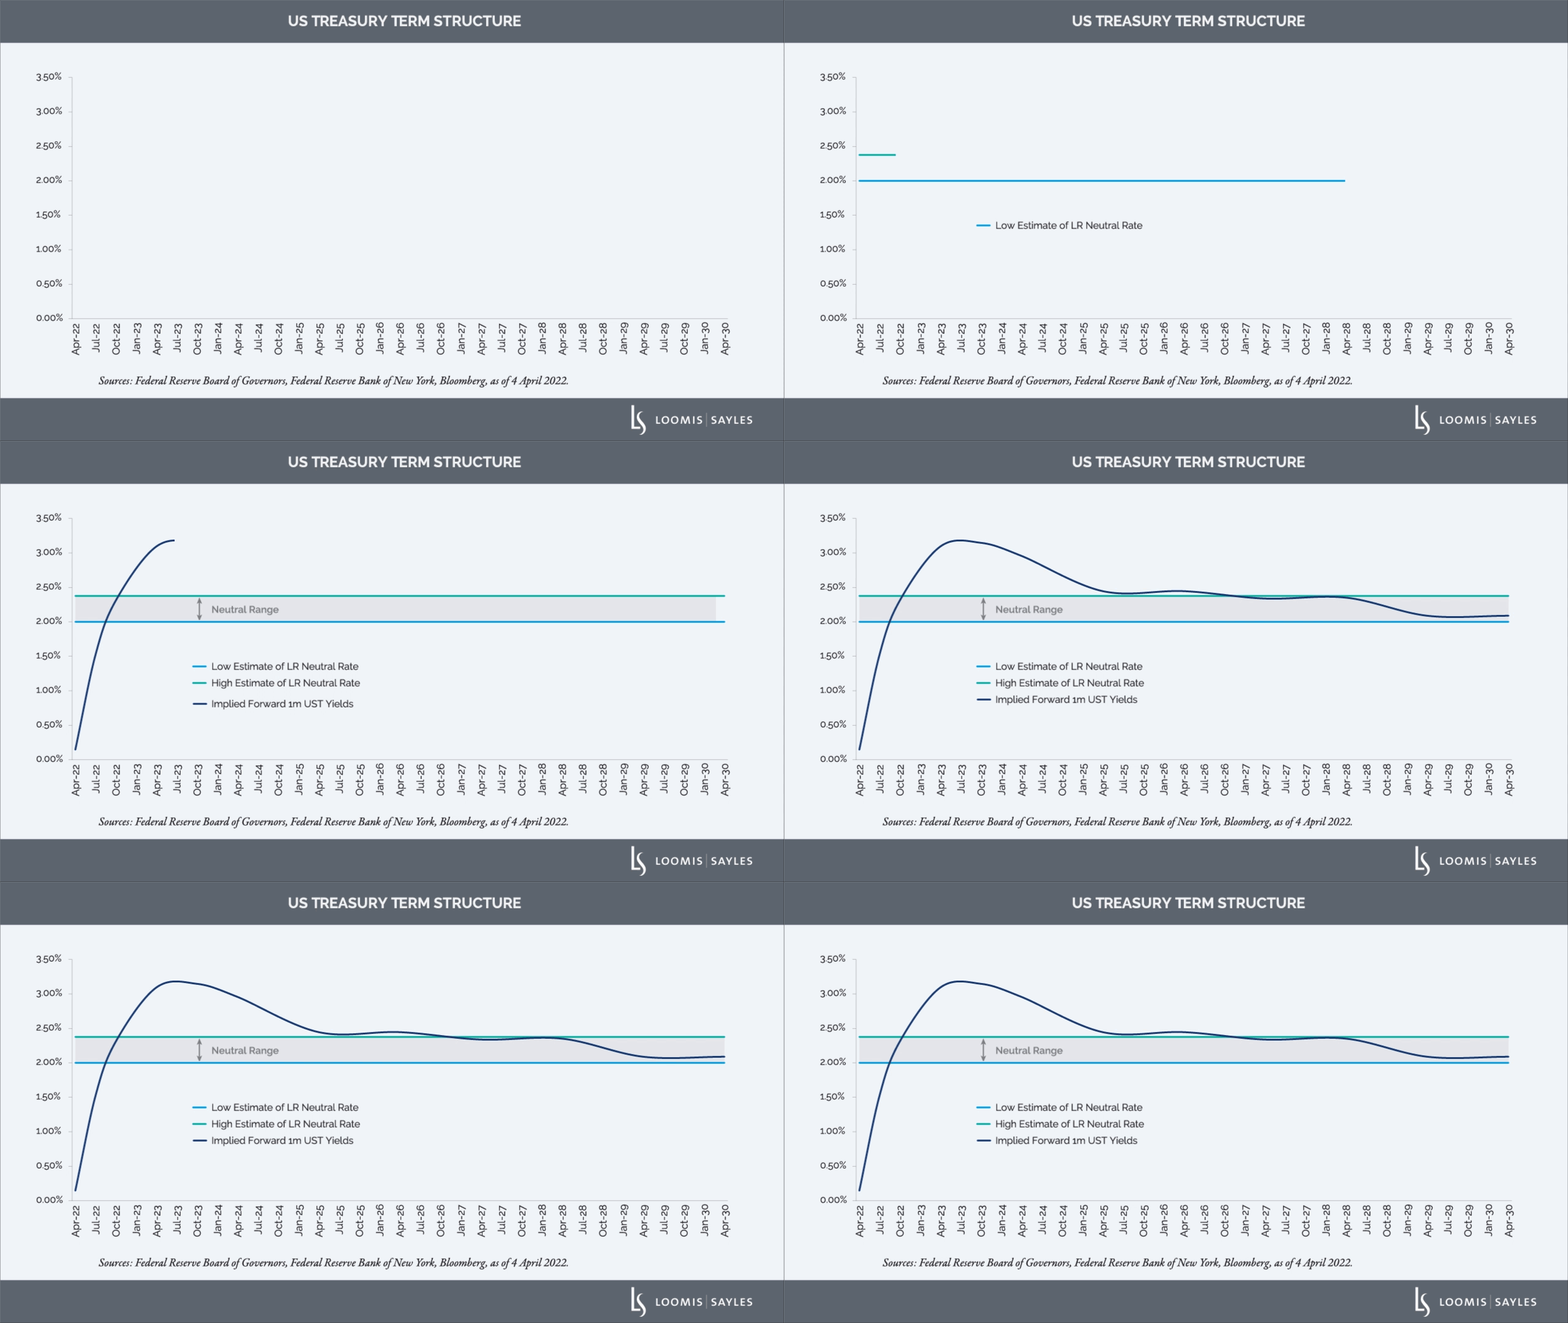
Finally, we believe the curve may be signaling market expectations for a “soft landing” - a mild cyclical downturn that rebalances the economy while avoiding recession. We believe the current yield curve implies that short-term rates will peak near 3% in about one year, then fall to about 2.25%, a level consistent with the estimated longer-run neutral policy rate (the rate at which monetary policy is thought to be neither accommodative nor restrictive). In our opinion, there is nothing unsettling in this implied path suggesting rates become only moderately restrictive (rising above neutral) before returning to, and not needing to fall below, the neutral setting.

Proceed with caution
We caution against over-interpreting the yield curve. In our opinion, the surest signal from the recent yield curve inversion is that we are transitioning from the expansion phase of the credit cycle into late expansion, with monetary policy on course to restrain the pace of the expansion. We do not believe this points to an imminent recession, or even an eventual soft landing, but it does suggest the road ahead is likely to remain challenging and uneven. We think the signal from the yield curve is not a red light, but a flashing yellow: proceed with caution.

MALR028820


