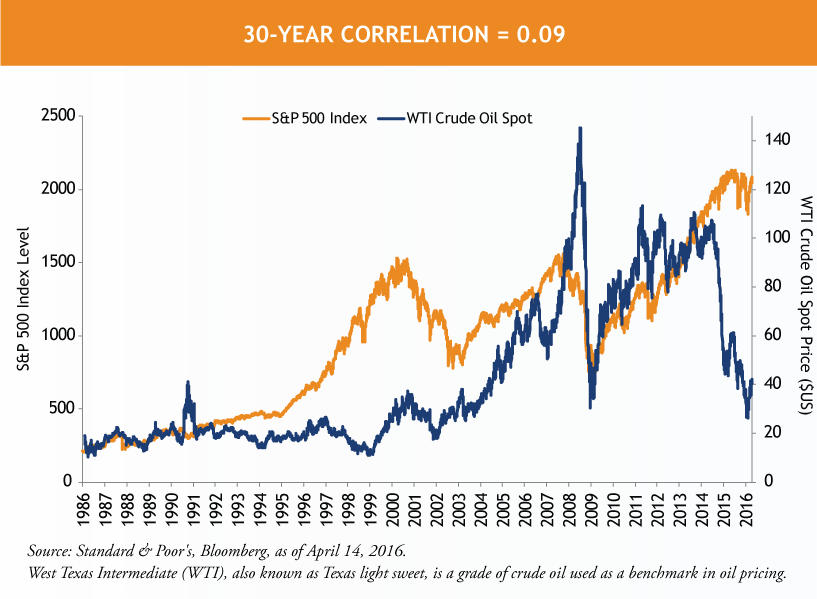
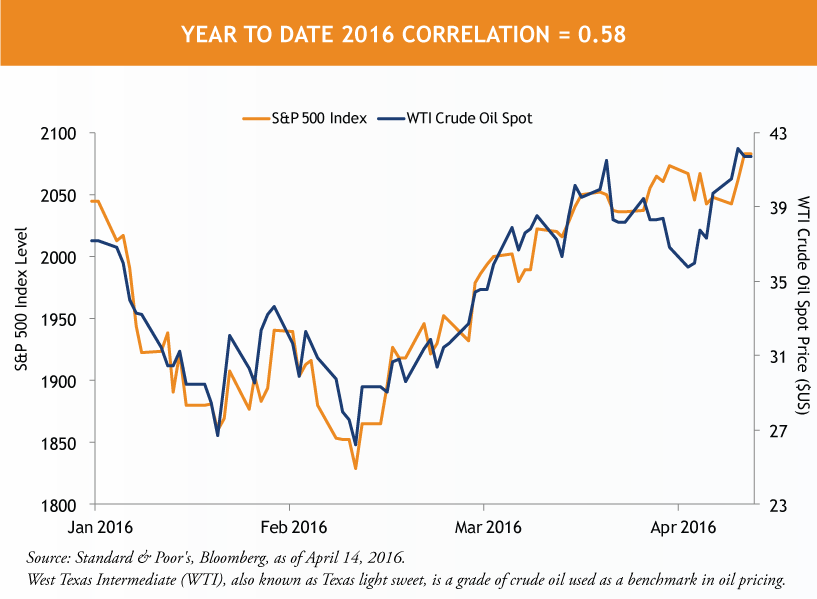
Over the last 30 years, the correlation between crude oil prices and the US equity market has been essentially zero. In the first quarter of this year, the correlation rose to 0.58.
Oil prices became an important barometer for risk-taking at the start of 2016. But, as is often the case, the relationship between the two is complicated. The S&P 500 energy sector is only 7% of the entire index -- so it is not driving index performance. The S&P 500 materials sector has obvious ties to energy and commodities, but only represents 3% of the index. So if the S&P 500 has only a modest commodity exposure (approximately 10%), why did the entire market collapse (and subsequently rally) along with crude oil?

As a result of the slow down, companies within the S&P 500 industrials sector that supply oil-producing companies with machines, replacement parts and services also suffered. Many energy companies also cut capital expenditure plans for new projects which dampened the outlook for industrials that supply the sector.
Most importantly, the energy sector borrowed heavily to fund operations. As oil broke $40 and headed for the low $30s, financial sector exposure to bad loans in the energy sector became a material near term earnings per share risk. Negative earnings revisions based on potential loan losses began to impact financial equities, which represent over 15% of the S&P 500. High yield spreads widened as credit markets grew increasingly tight, especially for lower quality issuers.
The year-to-date correlation of 0.58 between crude oil and the S&P 500 is strong but slowly trending lower now that higher oil prices have limited fundamental deterioration. As oil stabilizes, the overall market should become less correlated with oil prices.

MALR015031
Past performance is no guarantee of, and not necessarily indicative of, future results.
This is not an offer of, or a solicitation of an offer for, any investment strategy or product. Any investment that has the possibility for profits also has the possibility of losses.


