
 By
By 
New bond issuance exploded to record highs in 2020. Amid the crisis of a pandemic, companies were anxious to tap the markets and investors were happy to oblige. What was in it for issuers? In an uncertain time, they were still able to offer debt with historically low coupons while building up cash. On the other hand, investors, who had faced very narrow spreads for months, were attracted to high-grade and high-yield bonds trading 200+ basis points cheaper than just a month prior. The result was relative supply and demand balance—during a crisis.
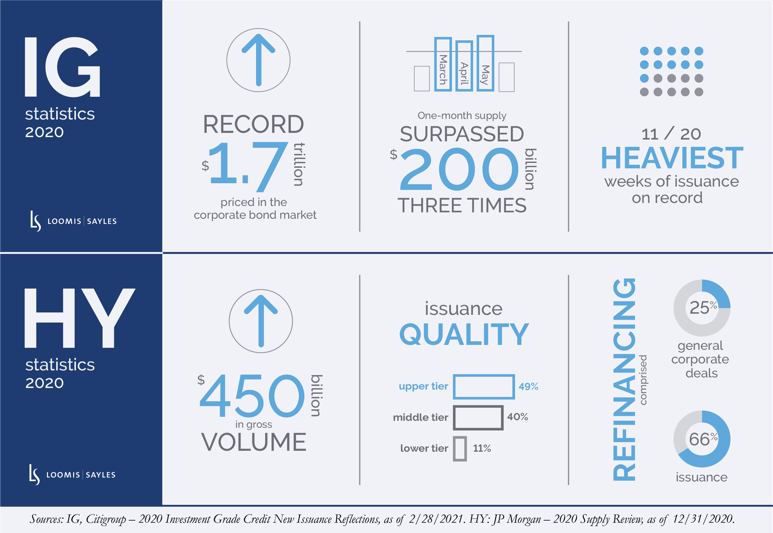
No surprise, 2020 statistics were dramatic
Who issued debt?
All types of companies got involved in the new issue market—whether they needed to or not. It appeared no one wanted to miss out on the opportunity to raise cash. Almost every sector had a year-over-year percentage increase in supply. In IG, large issuers included those in retail, telecom and capital goods. In contrast, healthcare/pharma, utilities and banks posted the smallest. REITs was the only sector which had a decline in issuance over the year. Significant HY issuance occurred in leisure, lodging and retail.
What’s notable
Amazingly, mergers and acquisitions (M&A) financing, normally a significant supply source, made a limited contribution to 2020’s IG and HY record supply. Instead, issuers in both markets focused on liability management, resulting in $150 billion of IG bond tenders (up 33% from 2019) and $280 of HY tenders. Issuers sought to remove near-term maturity risk where possible. We even saw issuers tender for bonds that they had just brought to market months prior.
Now what?
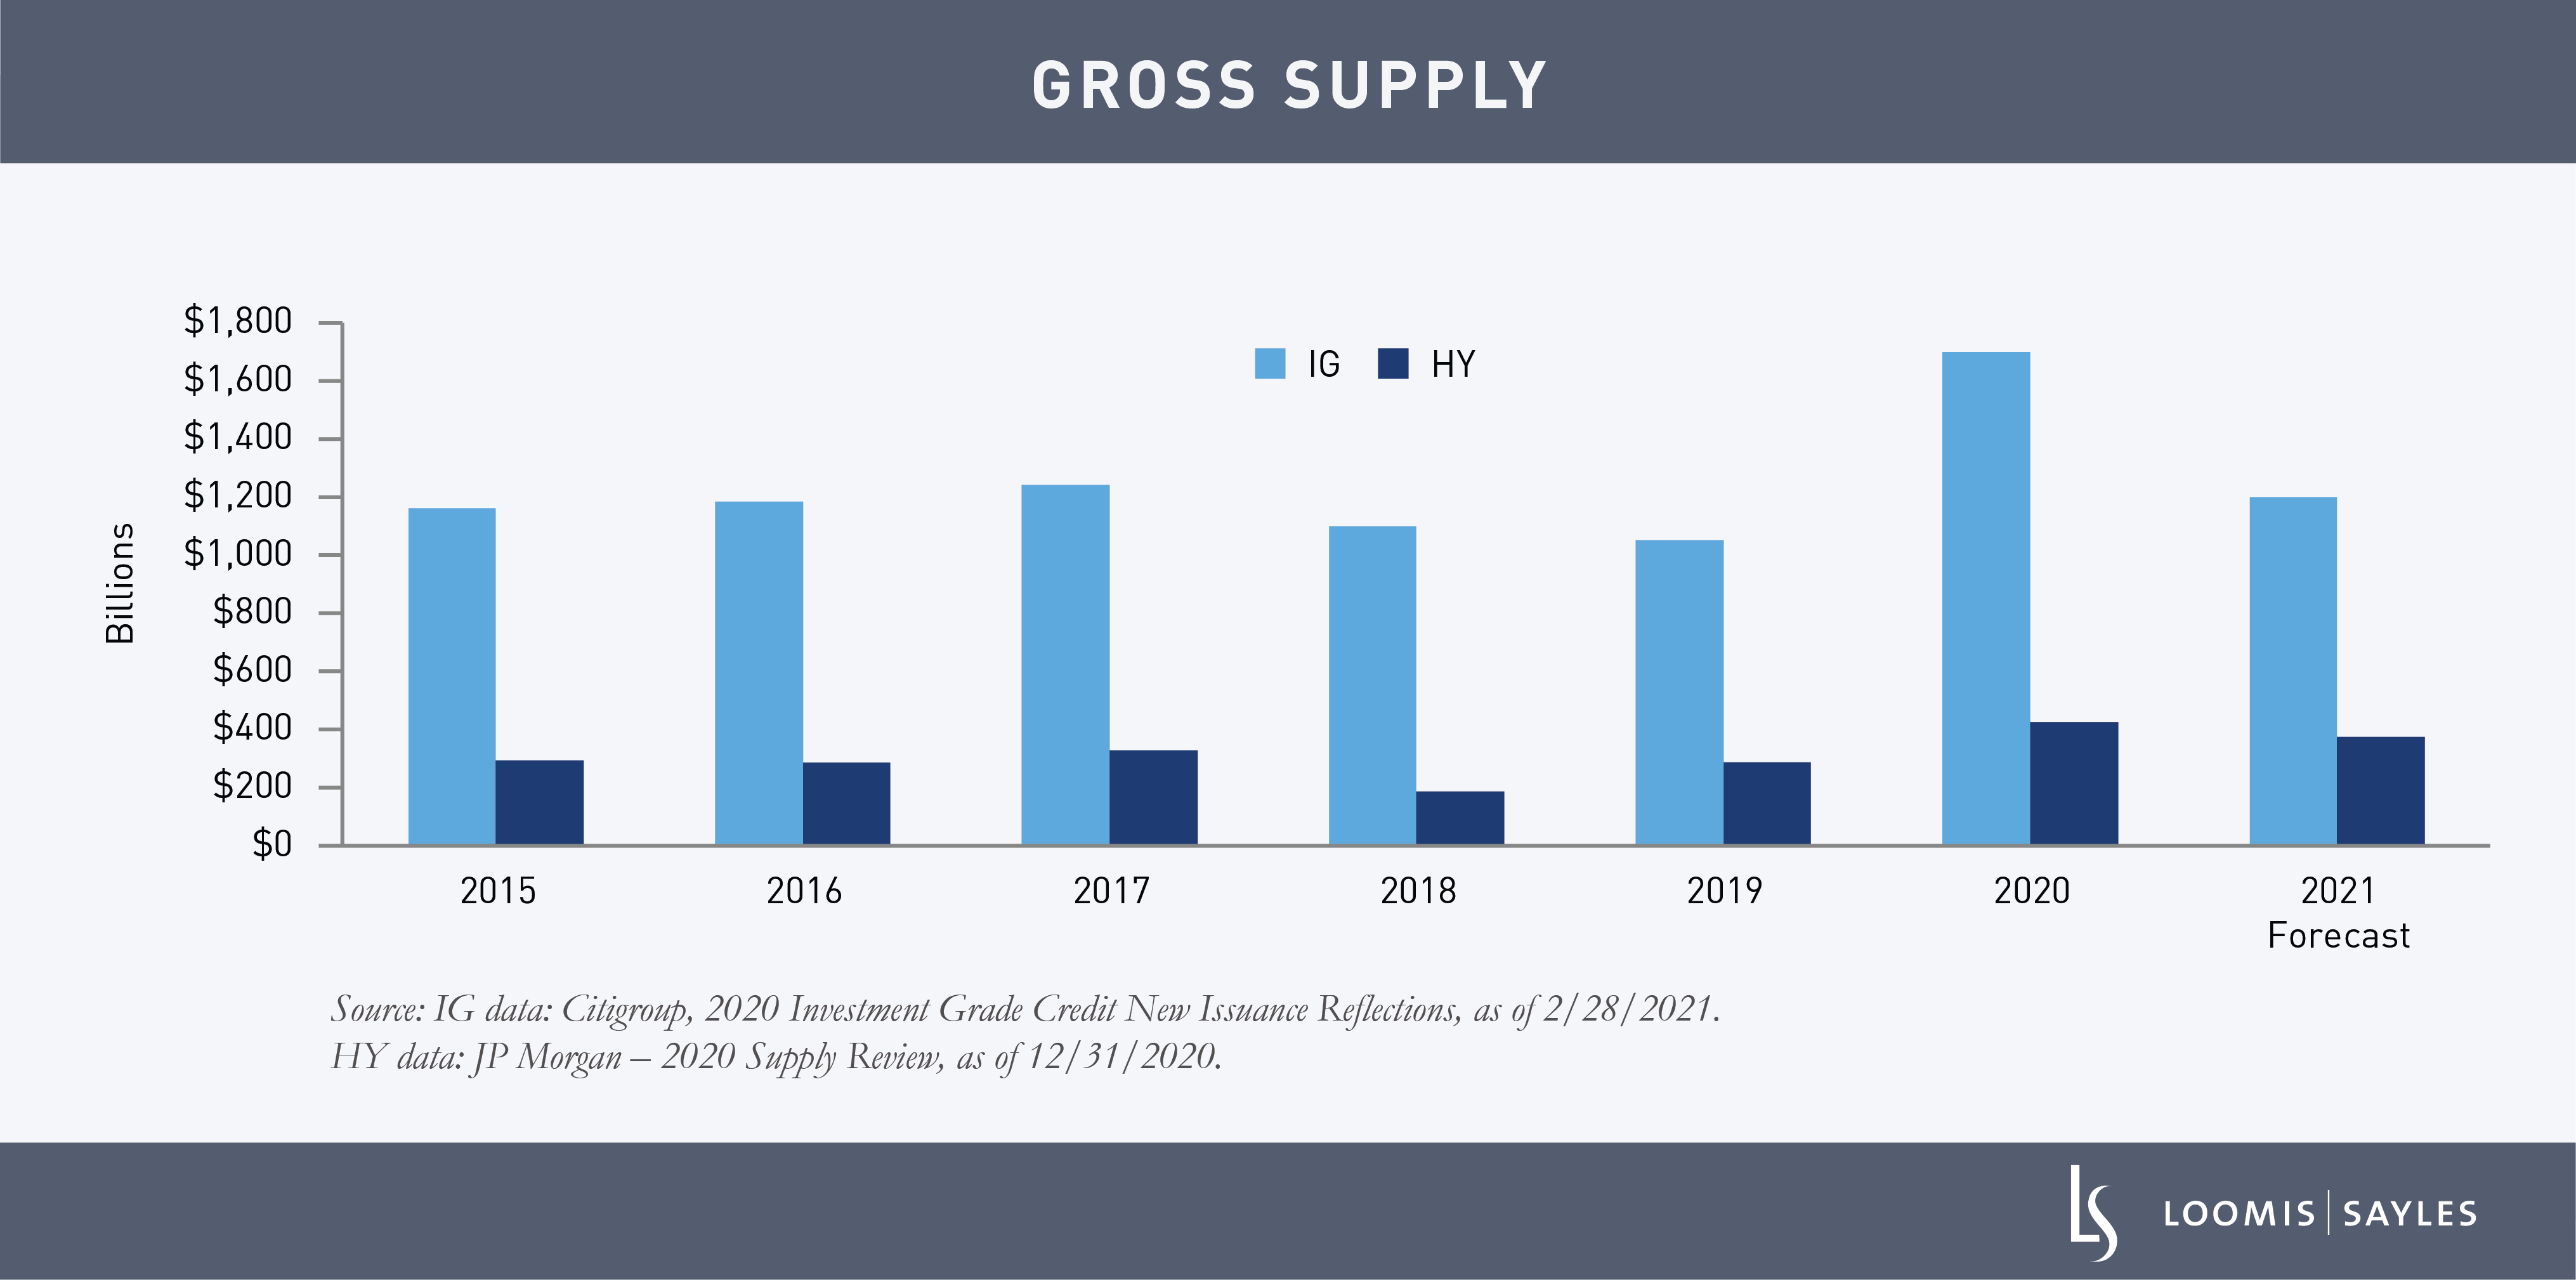
In IG, we estimate a more manageable $1.2 to $1.3 trillion will come to market in 2021. In the HY market, we expect approximately $375 billion this year. Overall, we envision more supply stability given positive pandemic trends and less economic uncertainty. After a robust pace of supply in the first quarter, issuance is almost flat to where it was this time last year. We believe supply will likely slow comparably throughout the remainder of the year, which could be a favorable technical environment for spreads.
What to watch
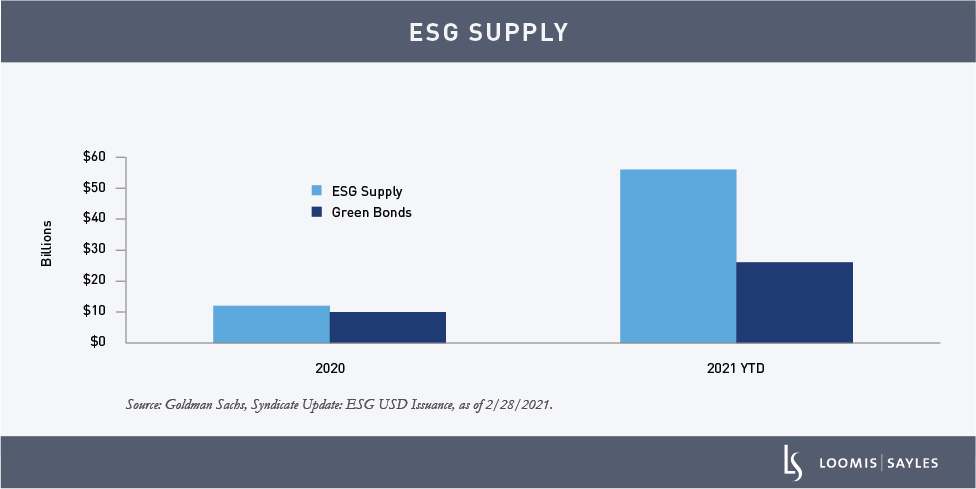
Interestingly, HY new issuance has moved down in quality. Only 20% of issuance this year has been in BB credits. So far in 2021, the HY primary market appears open for lower-quality refinancing.[i] A source of supply will likely be companies issuing Green Bonds and using the proceeds to support their carbon footprint reductions.[ii] Lastly, we expect M&A-related supply to continue to be light. We expect floating-rate note (FRN) issuance to pick up given the recent move higher in rates. So far this year, FRN supply has been approximately 5.5% of overall supply as of early March versus 2.5% in 2020.[iii]
From a maturity perspective, we are likely to see more 20-year maturities with the onset of 20-year corporates trading relative to 20-year Treasuries. Issuance of 20-year bonds is already 50% higher than that of 2020 in the same period.[iv] The seven-year part of the curve has also seen an uptick in issuance this year. Meanwhile, 30-year supply has been lower given the move in rates.
In summary, the high grade and high yield primary market were able to accomplish amazing things in 2020 in an unclear environment. As we continue to make progress on vaccines and get out of this pandemic we'll gain more clarity. The market likes clarity.

WRITTEN BY:
David Simmons, Senior Fixed Income Trader
Jack Celata, Senior Fixed Income Trader
Kevin Gribben, Senior Fixed Income Trader
Ted Cahill, Junior Fixed Income Trader
[i] JP Morgan, 2021 High-Yield Bond and Leveraged Loan Outlook, published December 2020.
[ii] Green Bonds finance projects intended to have a positive impact on the environment.
[iii] Citigroup, Syndicate Update 3/3/2021 & 12/31/2020 and 2020 Investment Grade Credit New Issuance Reflections, as of 2/28/2021
[iv] Source: Citigroup, Syndicate Update 03/3/2021 and 12/31/2020. Corporate bonds with 20-year maturities are now priced against 20-year Treasurys because of the volume/liquidity available in the 20 year part of the Treasury curve. In the past, they traded against 30-year Treasurys.
There is no assurance that developments will transpire as forecasted and actual results will be different. Data and analysis does not represent the actual, or expected future performance of any investment product. Information obtained from outside sources is believed to be correct, but Loomis Sayles cannot guarantee its accuracy. This material cannot be copied, reproduced or redistributed without authorization.
MALR027004
Market conditions are extremely fluid and change frequently.
This blog post is provided for informational purposes only and should not be construed as investment advice. Any opinions or forecasts contained herein reflect the
subjective judgments and assumptions of the authors only and do not necessarily reflect the views of Loomis, Sayles & Company, L.P. Information, including
that obtained from outside sources, is believed to be correct, but Loomis Sayles cannot guarantee its accuracy. This material cannot be copied, reproduced or
redistributed without authorization. This information is subject to change at any time without notice.

