
 By
By 
Although many seem focused on the dangers posed by the recent growth of subprime auto loans, we believe a major looming threat to consumers is coming from student loans. The increasing level of student debt on the millennial generation raises concerns about its sustainability and the impact it may have on known consumer behavior patterns.
How will the student debt burden impact home and auto purchases in the future? Will it affect the demographics of the American family as we know it today? Could the lack of spare income impair the travel, consumer goods and even retirement industries?
Here are five charts illustrating the troublesome trajectory of student loans:
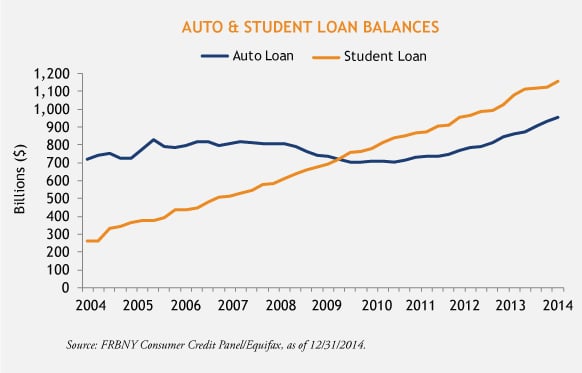
1. Auto and Student Loan Balances
In the last 10 years student debt outstanding has more than tripled to $1.16T. At the end of 2014, there were over 43 million student loan borrowers; 46% owe between $5,000 and $25,000.
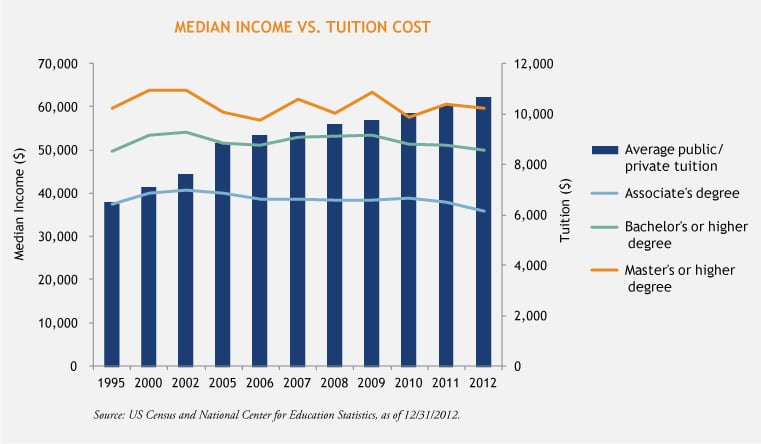
2. Median Income vs. Tuition Cost
Median income has remained flat while the cost of education has increased. Since 1995, the average cost of a four year public school has increased 89%, from $4,264 to $8,070.
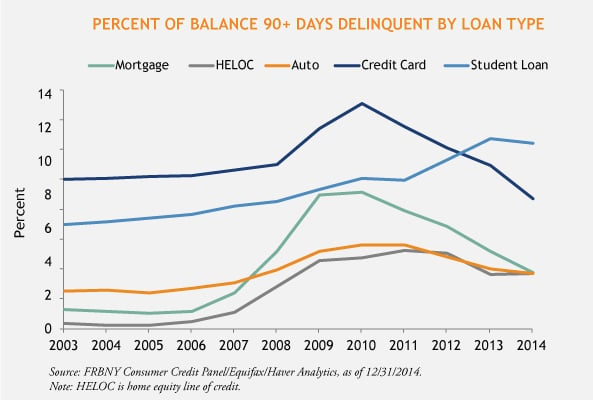
3. Percent of Seriously Delinquent Loans
Loan growth is rising - and performance is deteriorating. In a review of 90+ day delinquencies across various personal debt categories, it is the student loan sector that continues to rise while all others have decreased.
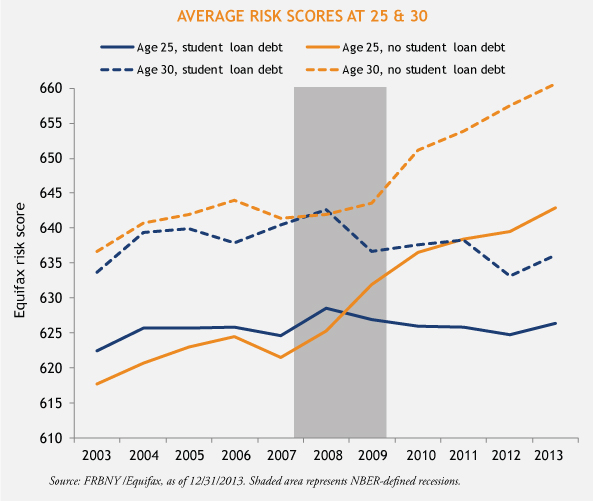
4. Average Risk Scores at 25 and 30
There’s no escape from a college loan. Unlike other consumer lending assets such as auto loans and credit cards, student loans are generally NOT dischargeable in bankruptcy and therefore can follow the loan holder throughout their entire life. Rising student loan debt is already having a negative impact on the credit score of the young borrowers.
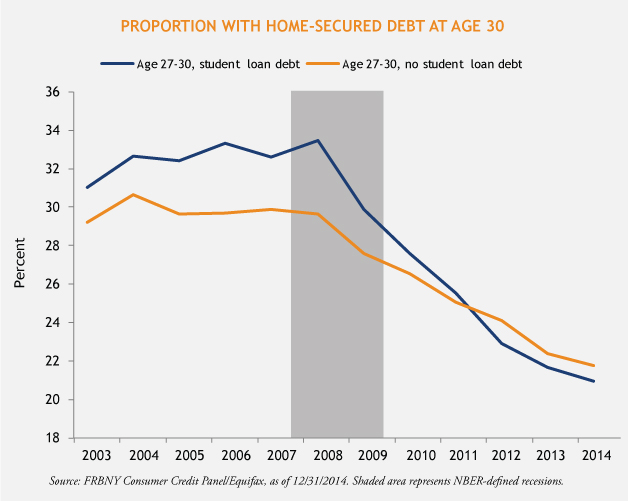
5. Proportion with Home-Secured Debt at Age 30
Given the tighter mortgage lending standards prevailing today, a less than perfect credit history can make home ownership an unattainable dream. This last chart shows that home ownership for those aged 27-30 with student loan debt has decreased at a much greater rate than those with no student loan debt. This trend could depress future household formation. Furthermore, there is some anecdotal evidence that even non-mortgage lenders are putting increased scrutiny on excess student loan debt during the underwriting process, thereby potentially constraining the ability to obtain other types of consumer loans.
MALR013090
Shaded areas represent NBER-defined recessions.
This blog post is provided for informational purposes only and should not be construed as investment advice. Any opinions or forecasts contained herein reflect the subjective judgments and assumptions of the authors only and do not necessarily reflect the views of Loomis, Sayles & Company, L.P. Information, including that obtained from outside sources, is believed to be correct, but Loomis Sayles cannot guarantee its accuracy. This material cannot be copied, reproduced or redistributed without authorization. This information is subject to change at any time without notice. Market conditions are extremely fluid and change frequently.

