
 By
By 
Editor’s Note: This post was originally published on December 12, 2014 and has been updated for freshness, accuracy and comprehensiveness. Any opinions or forecasts in this post reflect the subjective judgments and assumptions of the author as of December 2014.
It’s spring 2014. In a standoff with the rest of the world, Russia has just invaded Ukraine and is on the precipice of limiting oil supply to its western neighbors. ISIS has broken ground in Iraq, taken over the Kirkuk oil fields and heading towards Baghdad. Oil prices of $125 per barrel seem like a foregone conclusion.
But what unfolds next catches most by surprise: a rapid $30 decline in the Brent crude oil benchmark over a matter of weeks.Why? An unusual confluence of bullish geopolitics, extremely weak global demand and excess supply.

Geopolitics vs. global supply & demand dynamics
Typically, geopolitical threats manifest themselves through war or a supply shock in the commodity market – much like Kuwaiti oil production in the 1990s or Iraq in the 2000s. However, the situation last spring was more unique in that it didn’t result in any material decline in production.
In fact, Iraqi production grew as the Kurds won more autonomy and exported freely and Russia opted not to curb their oil exports. While existing supply was not disturbed, these high-profile geopolitics created a risk premium for oil prices.
And where did the premium show up? Much of the premium moved into deferred futures.
The chart below shows how spot prices fell with respect to deferred oil prices over the last year, demonstrating that the market had already priced in a higher probability of supply loss in the future.
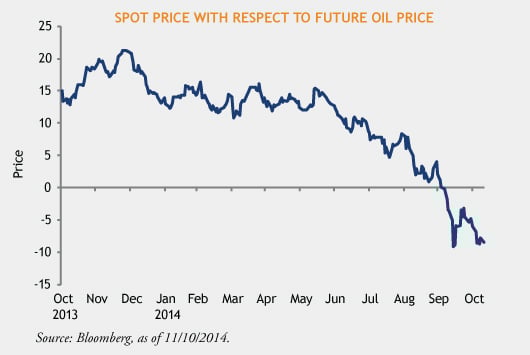
Front month has declined by over $25 with respect to the deferred month futures: Brent Dec’14 vs. Brent Dec’19, according to Bloomberg
However, the straw that really broke the camel’s back was the rapid onslaught of oil supply from Libya - production rose to 850,000 barrels per day from 200,000 barrels per day in Q3’14. This flooded the markets with sweet light oil which weakened the Brent crude benchmark and existing spot markets.
In addition, feeble demand emanating from the EU and emerging markets added to price weakness. Expectations slid from a solid 1.3 million barrels per day at the start of the year to an actual 600 thousand barrels per day, according to the International Energy Agency.
The misery didn’t end there. Hawkish Federal Reserve rhetoric resulted in a strong move upward in the US dollar, further exacerbating the decline in oil prices.
Oversupply, weak demand and a strong US dollar driving down prices
Oil markets have experienced a perfect storm as a combination of oversupply, weak global demand and a strong US dollar brought prices down to $65 per barrel. OPEC’s recent refusal to curtail production in the face of oversupply is a dramatic shift; they have moved from setting a price floor to a strategy driven by market share. Generally when inventories are low and supply-demand balance is tight, commodities tend to trade at a premium to marginal cost. However, the reverse occurs when commodity balances are loose – commodities tend to trade closer to marginal cost. OPECs refusal to be the marginal barrel now puts the onus on US shale producers, who have a lower cost of production – typically under $75, according to my calculations.
Next year: Price declines expected to continue
I calculate that about 1.7 million barrels per day of black gold will enter the market next year. Of this the US makes up 1.2 million barrels per day. Canada and Brazil make up the rest.
Demand remains a function of global growth – It is my estimation that 3% global growth would require an estimated one million barrels per day of additional oil. This year, however, demand averaged only half that.
The Loomis Sayles base scenario of 3% global GDP will roughly put global supply/demand imbalance for 2015 at little over 500,000 barrels per day. This is in addition to the roughly 850,000 barrels per day of Libyan production which we perceive as excess. Our base case is that because of this over-supply, the Brent crude oil benchmark could remain low in the near term. However, as US oil production slows and the market re-balances, we expect prices to rebound to more sustainable levels. Going forward, we also expect a meaningful drop in price volatility, similar to other periods of supply-driven imbalances.
There are several dynamics at play here that could alter these forecasts. Any one of these could swing oil prices to the tune of over $10 in either direction. As we continually assess, these are the questions we ask ourselves daily:
- How sustainable is Libya’s production? Prior to the Middle East North Africa (MENA) crisis, Libya produced over 1.5 million barrels per day. Although production has risen over the past few months, the political situation is far from stable making it difficult to assess if Libya can make continued gains to peak production or if they will see declines back to zero.
- What is the potential impact of long-term sanctions on Iran and Russia? The European Union and the Obama administration are in talks with Iran to strike a deal on Iran’s nuclear ambitions. This could lighten the sanctions and bring more oil into the market.
- Will Saudi Arabia fight for market share or will they buckle to low oil prices and eventually make some production cuts? In our view, if Saudi Arabia doesn’t authorize production cuts, US shale oil/ WTI will likely become the marginal barrel at under $75. When prices are this low, it generally stimulates demand and forces capital expenditure cuts. If we see oil prices plunge into the $70s it could force domestic supply cuts in the US.
MALR013756
All prices in USD.
This was originally published on December 12, 2014. We have updated the content as necessary and otherwise believe the information is current and relevant.
Past results are not necessarily indicative of future results.
This is not an offer of, or a solicitation of an offer for, any investment strategy or product. Any investment that has the possibility for profits also has the possibility of losses. Views and opinions are based on current market conditions which will change.
This blog post is provided for informational purposes only and should not be construed as investment advice. Any opinions or forecasts contained herein reflect the subjective judgments and assumptions of the authors only and do not necessarily reflect the views of Loomis, Sayles & Company, L.P. Information, including that obtained from outside sources, is believed to be correct, but Loomis Sayles cannot guarantee its accuracy. This material cannot be copied, reproduced or redistributed without authorization. This information is subject to change at any time without notice. Market conditions are extremely fluid and change frequently.

