
 By
By 
For many investors, it’s pretty unsettling to hear that the market’s “fear gauge” is suddenly on a tear. But that’s what happened over the past week. That fear gauge, formally known as the VIX[i], rose almost 300% in three trading days, signaling an end to the market calm that dominated in 2017. It also triggered a chain reaction that caused problems for investors who’d been betting against volatility.
A lot of the coverage about what happened uses terms like futures curves, ETPs and “short vol”—it can get complicated. Let’s break down the components piece by piece.
What are VIX futures all about?
The VIX is an index that measures how much equity volatility the market expects in the near term. A higher index level means a higher level of expected volatility, and vice versa. Investors commonly use VIX futures[ii] to hedge or to speculate about how the level of volatility might change down the road.
In 2017, the average closing level of the VIX Index was 11.10, among the lowest levels ever recorded. Despite this low level, the VIX futures curve was still relatively steep, so two-month futures were at higher levels than one-month futures, which were higher than the current level of the VIX. This “steepness” meant buying VIX futures to hedge or to speculate that volatility would go higher was a costly proposition. Let’s use an example to explain why.
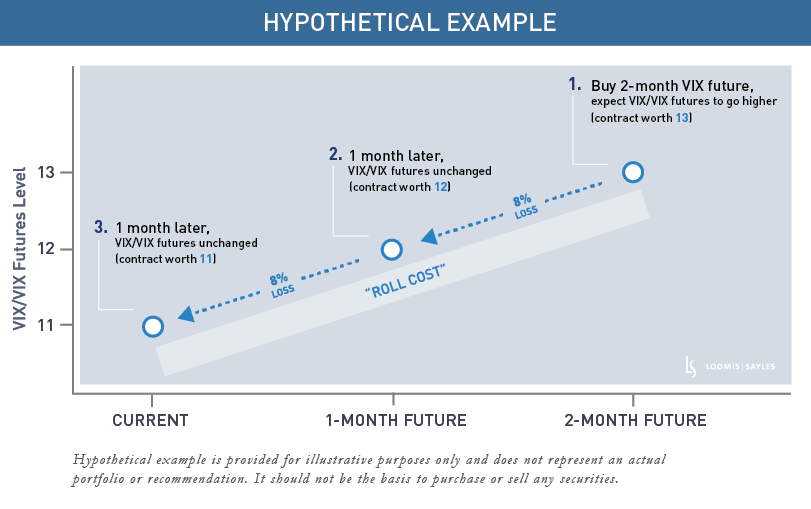
Hypothetically, let's say the VIX is trading at 11, one-month futures are trading at 12, and two-month futures are trading at 13. As an investor, I buy the two-month future at 13 to express a belief that expected volatility will rise. Then one month goes by, but the level of the VIX and VIX futures hasn't changed. The two-month future that I bought at 13 now has one month to expiration and is now only worth 12. This equates to a loss of 8%! If I continue to hold this another month, and the level of the VIX and VIX futures still don’t change, my 12 would go to 11 (where the VIX is currently trading) and I would lose an additional 8%. This is what investors call the “roll cost” associated with being long volatility.
What is an ETP?
The VIX futures market is largely an institutional market, but in 2010, exchange-traded products (ETPs) were created to make volatility trading more accessible to retail investors. Some ETPs allow an investor to express a long view on volatility in the S&P 500® Index; they will gain value if volatility rises, but are subject to the “roll costs” as described above if volatility doesn’t change and will lose value if volatility falls. In 2011, a new kind of ETP emerged that allowed investors to express a short view on volatility (called inverse ETPs). Inverse ETPs lose value if expected volatility rises and gain value if expected volatility falls. Importantly, investors in inverse ETPs will also receive the “roll cost,” so in the hypothetical example above, they would make 8% per month if expected volatility didn't change.[iii]
The “short vol” trade
Inverse ETPs are effectively a bet against volatility, and this is what the “short vol” trade was all about. Prior to the dip in the market that started on January 29, the S&P 500 had not had a 5% correction in 400 trading days—this was the longest run without a 5% correction in 50 years! Given that backdrop, it is not surprising that the VIX was also historically low in 2017. In this type of environment, inverse ETPs were steadily rewarded because volatility rarely became elevated. Investors flocked into this type of strategy, as yield was scarce in other asset classes, and the risk/return tradeoff—in 2017’s low-volatility environment—seemed very favorable.
But in February 2018, volatility woke up. On February 1, the VIX hit an intraday low of 12.59. On February 6, the VIX hit an intraday high of 50.3, an increase of almost 300% in three trading days! The VIX’s move on Monday, February 5—when it shot up 100% in one trading day—had a severe impact on short volatility and many inverse ETPs.
The net asset value of the most used inverse volatility ETPs (that lose money if volatility goes up) went from several billion dollars to hundreds of millions. One of the larger ETPs was forced to liquidate. Since the price of inverse ETPs can’t go below $0.00 and volatility can more than double in a day, this creates an issue. Many ETPs use an 80% threshold as a termination event, meaning that if the product loses more than 80% of its value in a single day, the product may be liquidated.
No such thing as a sure thing
Risk and return are an inextricable pair. But when markets are calm and well behaved, it can be tempting to minimize the former and emphasize the latter. The recent swings in the VIX and the fallout in the “short vol” trade are good reminders that markets can change quickly, and that, in our view, understanding the risks associated with an investment is as important as having a view on the potential return.

MALR021378
[i] The Cboe Volatility Index® (VIX® Index) is a measure of market expectations of near-term volatility conveyed by S&P 500® Index stock index option prices.
[ii] A futures contract is an agreement traded on an organized exchange to buy or sell assets at a fixed price on a future date.
[iii] Volatility ETPs target a constant maturity (e.g., 30 days). In order to maintain this constant maturity, the ETP provider on a long volatility ETP will be selling futures on the front month contract and buying futures on the second month in small increments each day. This process creates a similar “roll cost” that is described in the example above. It should be noted that in times of market stress, the futures curve may invert, and the “roll cost” would then become a benefit, as the VIX would be higher than VIX futures.
Past market experience is no guarantee of future results.
Indices are unmanaged and do not incur fees. It is not possible to invest directly in an index.
Commodity interest and derivative trading involves substantial risk of loss.
This is not an offer of, or a solicitation of an offer for, any investment strategy or product. Any investment that has the possibility for profits also has the possibility of losses.
This blog post is provided for informational purposes only and should not be construed as investment advice. Any opinions or forecasts contained herein reflect the subjective judgments and assumptions of the authors only and do not necessarily reflect the views of Loomis, Sayles & Company, L.P. Information, including that obtained from outside sources, is believed to be correct, but Loomis Sayles cannot guarantee its accuracy. This material cannot be copied, reproduced or redistributed without authorization. This information is subject to change at any time without notice. Market conditions are extremely fluid and change frequently.

